


 Inglés (pdf)
 Articulo en XML
 Referencias del artículo

 Permalink
Mental and substance use disorders are among the world's leading contributors to the total disease burden, as measured by the number of years lived with a disability (Global Burden of Disease 2017 Risk Factor Collaborators, 2018). It is estimated that nearly one billion people worldwide live with mental disorders, with anxiety and depressive disorders among the most prevalent (World Health Organization, 2022). Globally, approximately 10.7 % of the population suffers from some mental disorder, while the most prevalent are anxiety, depression and alcohol abuse disorders (Dattani et al., 2021).
In Argentina, an epidemiological study carried out on a sample of 3.927 adults from the general population from different regions of the country selected through multistage probabilistic sampling reported that the lifetime prevalence of any mental disorder was 29.1 % (Cía et al., 2018; Stagnaro et al., 2018). The projected risk of life to age 75 was 37.1 %. The disorders with the highest lifetime prevalence were major depressive disorder (8.7 %), alcohol abuse disorder (8.1 %), and specific phobia (6.8 %). Regarding the groups of disorders, anxiety disorders are the most prevalent disorders (16.4 %), followed by mood disorders (12.3 %), substance disorders (10.4 %), and impulse control mental disorders (2.5 %). The prevalence of any mental disorder in the last 12 months was 14.8 %, and a quarter of these were classified as severe. They also reported that females were more likely to develop any mental disorder (Cía et al., 2018; Stagnaro et al., 2018).
An investigation carried out during the epidemic outbreak in a sample of 2.547 participants from different regions of Argentina (Etchevers et al., 2021) found that 12.51 % of the sample presented a risk of suffering from a mental disorder. Also, participants reported fewer years of age and lower perceived socioeconomic status, and higher levels of nonspecific psychological symptomatology, anxiety, depression, and suicidal risk were observed. Likewise, the study reported that the consumption of alcohol, drugs, and tobacco was significantly associated with psychological symptoms. At the same time, females reported more symptoms than males. Additionally, it has been found that people who live in regions of Greater Buenos Aires informed less perceived health status, greater anxious and depressive symptoms, and fewer health coverage alternatives than those who live in the City of Buenos Aires (Rodríguez Espínola et al., 2019).
Given the prevalence of mental disorders and elevated psychological symptoms, there has been a call for action to scale up health services (Patel et al., 2018). In this sense, to provide optimal care, it is essential for the early detection of symptoms, as well as to evaluate the psychological state during treatment (Maruish et al., 1998). Although the arrival at diagnoses depends on different tools, self-report measures are the most used in the field of psychopathology to evaluate specific diagnoses and explore psychological symptoms (Holgado-Tello et al., 2019).
One of the most widely used self-report measures for examining psychological symptoms is the Symptom Checklist-90 (SCL-90) (Derogatis, 1977, 1994; Derogatis & Cleary, 1977). The SCL-90 comprises 90 items that assess nine dimensions: depression, hostility, interpersonal sensitivity, somatization, anxiety, psychoticism, obsession-compulsion, phobic anxiety and paranoid ideation. A revised version of the instrument, also with 90 items, which, in addition to measuring the nine basic dimensions, made it possible to obtain three global measures of psychological stress, was subsequently published (Derogatis & Savitz, 1999). However, both versions presented problems that promoted the development of abbreviated versions of the instrument: the high number of items, the overlapping of the items, the high correlations between the dimensions, and the instability of the factorial structure (Holgado-Tello et al., 2019; Sandín et al., 2008). Thus, the Symptom Assessment-45 Questionnaire (SA-45; Davison et al., 1997) was developed. The SA-45 also evaluates nine dimensions referring to psychological symptoms through half the number of items than its predecessors and avoiding overlapping items. The original study allowed a preliminary psychometric analysis through which the items comprising the instrument were selected. The conclusion was reached that the items evaluate nine dimensions through cluster analysis; the factorial structure was validated through the contrasted group method and reliability values between alpha= .69 (psychoticism) and alpha= .92 (depression) were found (Davison et al., 1997).
Maruish et al. (1998) investigated the psychometric properties of the SA-45 in 126 nonpatient adult participants in the context of a project designed to demonstrate the benefits of integrating behavioral healthcare services in primary medical care. Specifically, the study sought to evaluate the appropriateness of the SA-45's adult nonpatient norms and cross-validation of its test-retest reliability and construct validity. Results suggest that using the SA-45 nonpatient norms with primary care populations is appropriate and adequate three-month test-retest stability. In addition, correlations among the SA-45 scales and indices and their correlations with other measures provided evidence of SA-45's psychometric integrity.
The SA-45 has also been studied at the psychometric level in different Spanish-speaking countries. In Spain, Sandín et al. (2008) studied its psychometric properties in 420 college students from different universities in Madrid. Through exploratory and confirmatory factor analysis, results suggested a factorial structure of nine dimensions similar to the one proposed by Maruish et al. (1998) and evidence of reliability, with alpha values ranging from .63 (psychoticism) to .85 (depression). Holgado-Tello et al. (2019) analyzed the psychometric properties of the SA-45 in 823 university students from Spain. To analyze its dimensionality, exploratory and confirmatory factor analysis was used. The results showed the adequacy of a model comprised of nine dimensions, of which the majority contained a combination of items from Maruish et al.'s (1998) dimensions. Regarding reliability, alphas ranged from .57 (psychoticism) to .87 (paranoid ideation).
In Mexico, Alvarado et al. (2012) investigated the validity and reliability of the SA-45 in 418 university students from Mexico. The adequacy of a 9-factor structure similar to the one proposed by Maruish et al. (1998) was found through confirmatory factor analysis, as well as evidence of reliability through alpha values that ranged between .57 (psychoticism) and .85 (depression, interpersonal sensitivity and hostility).
In Argentina, Vizioli & Crespi (2020) evaluated the local version of the SA`s psychometric properties in 430 adult participants from the City of Buenos Aires and the Buenos Aires suburbs. Through confirmatory factor analysis, they arrived at a 34-item instrument that evaluates nine dimensions, according to the model proposed by Maruish et al. (1998). The factors of depression, interpersonal sensitivity, somatization, anxiety, obsession-compulsion, phobic anxiety and paranoid ideation comprised four items, while the psychoticism and hostility factors comprised three items. Regarding reliability, alpha coefficients with values between .72 (psychoticism) and .93 (phobic anxiety) and omega coefficients with values between .73 (psychoticism) and .92 (phobic anxiety) were reported.
Also in Argentina, in a sample made up of participants from the City of Buenos Aires and the Buenos Aires suburbs, an abbreviated version of 27 items of the local version of the original SCL-90 (Casullo, 1998) was created (Góngora & Castro Solano, 2021). In a general population sample of 400 people and 80 clinical population, the authors found high correlations between the scales of the abbreviated version of the instrument and the original version, adequate reliability, and differentiated scores for the general and clinical samples.
In general, one of the issues with the SCL-90 is its length, which can complicate its application in settings where rapid detection is necessary, such as primary care. In this sense, there have indeed been subsequent advancements, particularly in local contexts (Góngora & Castro Solano, 2021; Vizioli & Crespi, 2020), that have addressed this issue by presenting alternatives for quickly measuring psychological symptoms. These advancements allow researchers and clinical psychologists to have appropriate tools for their work.
Although there are different instruments to measure psychological symptoms in Argentina, it is necessary to have evidence about the constructs they measure in particular and their psychometric quality, so that professionals and researchers who want to use them have as much information as possible to facilitate choosing the most appropriate instrument for each case. Since the study by Vizioli y Crespi (2020) was the first study of the Brief Psychological Symptoms Inventory in Argentina, the present study aims to provide new psychometric evidence of the instrument, particularly about its internal structure. The main objectives are 1) to analyze the factorial structure of the instrument, 2) to assess measurement invariance across gender and region, 3) to evaluate reliability, and 4) to obtain population-based norms. The measure could be important for its use in primary health services (Maruish et al., 1998) due to its ability to evaluate psychological symptoms with relatively few items.
Materials and Methods
An instrumental study (Ato et al., 2013) was carried out with the purpose of analyzing the psychometric properties of the Argentine version of the SA.
Participants
Through non-probabilistic and intentional sampling, 760 individuals from Buenos Aires City (41.2 %; n = 313) and Greater Buenos Aires (58.8 %; n = 447), with ages ranging from 18 to 63 (M= 28.1; SD = 8.61). Regarding gender, 70 % (n = 532) reported female and 30 % (n = 228) were male. As for education level, 74.2 % (n = 564) informed incomplete college studies, 15.3 % (n = 116) complete college studies, 5.5 % (n = 42) postgraduate studies, 4.6 % (n = 35) and 0.4 % (n = 3) incomplete high school. Regarding marital status, 62.6 % (n = 476) were single, 34.6% (n = 263) married or living together, and 2.8 % (n = 21) were divorced or separated.
Measures
Sociodemographic questionnaire: questionnaire collected information about gender, age, education, marital status and region of residence (Buenos Aires City or Greater Buenos Aires).
The short version of the Symptom Checklist (Vizioli & Crespi, 2020) provides a self-report measure of psychological symptoms according to nine dimensions: depression, hostility, interpersonal sensitivity, somatization, anxiety, psychoticism, obsession-compulsion, phobic anxiety and paranoid ideation. The instrument consists of 34 items on a five-level Likert scale ranging from 0 (Not at all) to 4 (Very much so, or extremely). The scale has been shown to have good psychometric properties with coefficients alpha values ranging from .72 to .93 and omega coefficients ranging from .73 to .92 and confirmatory factor analysis supporting the nine correlated dimensions model (Vizioli & Crespi, 2020). The measure has been normed on a non-patient sample of adults (N = 430), with raw scores transformed into T-scores (M = 50, SD = 10).
Procedure
Data were collected using virtual platforms. Participants completed the informed consent process followed by the administration of the instrument as part of an online survey. The informed consent outlined the investigation's objectives, guarantees of confidentiality and anonymity, voluntary and uncompensated participation, and the option for participants to withdraw at any time. This study adhered to the ethical principles of the Declaration of Helsinki (World Medical Association, 2013) governing research involving human subjects, as well as recommendations from the American Psychological Association (2010).
Data analysis
The factor structure of the Argentine version of the symptom checklist was evaluated through confirmatory factor analysis. Four models were compared in concordance with previous research (Sandín et al., 2008; Vizioli & Crespi, 2020): 1) a model of 9 correlated factors, 2) a single factor model, 3) a model of 9 primary factors and two higher-order factors, called "distress" (depression, somatization, anxiety, obsession-compulsion, and phobic anxiety) and "psychosis" (hostility, psychoticism and paranoid ideation), and 4) a single higher-order factor with nine primary factors model. A large enough sample was collected to obtain consistent estimates (Kyriazos, 2018). Since items have four response options, data were treated as ordinal (Rhemtulla et al., 2012), and diagonal weighted least squares (DWLS) estimation method with the calculation of Satorra-Bentler scaled χ2 statistic and robust standard errors was used (Li, 2016). The fit was assessed using several indices: Satorra-Bentler scaled χ2; Comparative Fit Index (CFI), Tucker Lewis fit Index (TLI), Goodness of Fit Index (GFI), Relative Fit Index (RFI), Root Mean Square of Approximation (RMSEA), and Standardized Root Mean Square Residual (SRMR). CFI, GFI, RFI and TLI values of ≥ .90 and ≥ .90 were judged adequate and excellent, respectively; RMSEA values of ≤. 08 were considered acceptable, and SRMR values of ≤. 08 were indicative of a good fit (Byrne, 2016; Hoyle, 1995; Hu & Bentler, 1999). Standardized factor loadings of ≥.40 were considered acceptable (Brown, 2015).
Measurement invariance was tested across gender (females (n = 532) vs males (n = 228) and region Buenos Aires City (n = 313); vs Greater Buenos Aires (n = 447). As Byrne (2016) recommended, configural, metric and scalar invariance were assessed. To assess configural invariance, the fit of an unrestricted model, which serves as a baseline, was tested (Wang et al., 2018). To test metric invariance, a model with constrained factor loadings across groups was assessed to determine if respondents attribute the same meaning to the latent construct (van de Schoot et al., 2012). Scalar invariance was tested, assessing the fit model with factor loadings and intercepts constrained to be equal across groups. Changes in the goodness of fit indexes were evaluated for invariance testing (Wang et al., 2018). Due to χ2 statistic's sensitivity to sample size (van de Schoot et al., 2012), changes of ≤.01 change in CFI, paired with changes in RMSEA of ≤.015 and SRMR of ≤.030 (for metric invariance) or ≤.015 (for scalar invariance) were considered as an indication of invariance (Chen, 2007). All CFA procedures were performed using Jamovi 2.3 software, with SEMLj module (Gallucci & Jentschke, 2021), which provides an interface for lavaan (Rosseel, 2019).
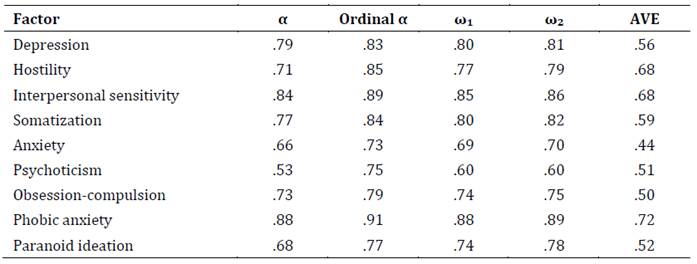
The average variance extracted (AVE) was calculated as an indication of convergent validity. Values of AVE of .50 were considered acceptable (Hair et al., 2010). Values greater than .40 were interpreted together with the reliability indices to judge them as acceptable or not (Fornell & Larcker, 1981).
As Flora (2020) recommended, categorical unidimensional omega, as proposed by Green and Yang (2009), and a variation of Green and Yang's formula was computed. While some authors recommend using Green and Yang's approach ignoring ordinal alpha (Chalmers, 2018; Flora, 2020), both Cronbach's (1951) and ordinal alpha (Zumbo et al., 2007) are provided as an indicator to be able to make comparisons with previous literature. Values ≥ .70 were judged as acceptable (Groth-Marnat, 2009).
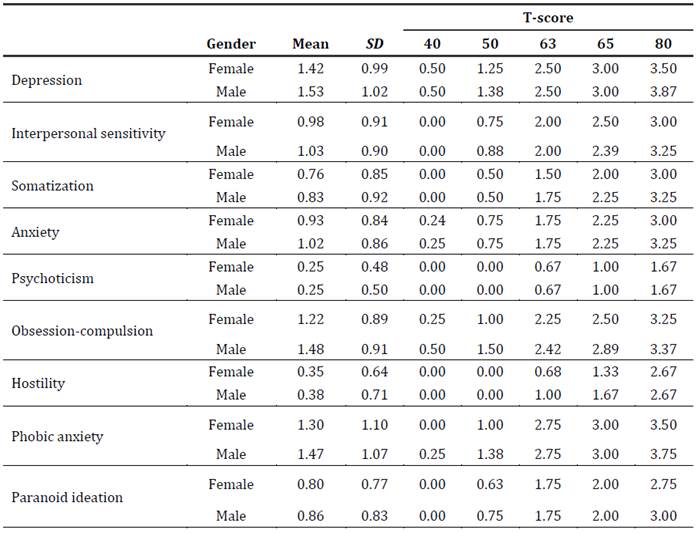
According to previous research, population-based norms were calculated using T-scores, with scores of 60 or greater indicating psychological impairment (Derogatis, 1994; Maruish, 2004; Vizioli & Crespi, 2020).
Results
Factor structure
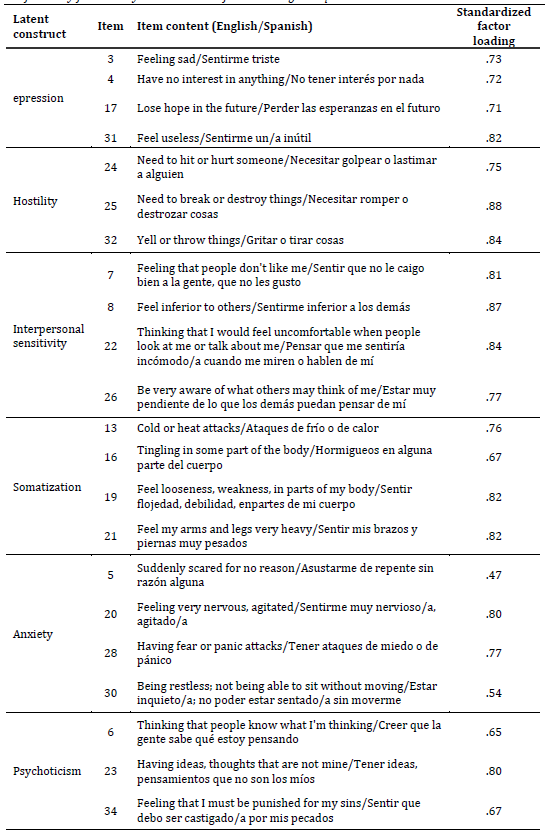
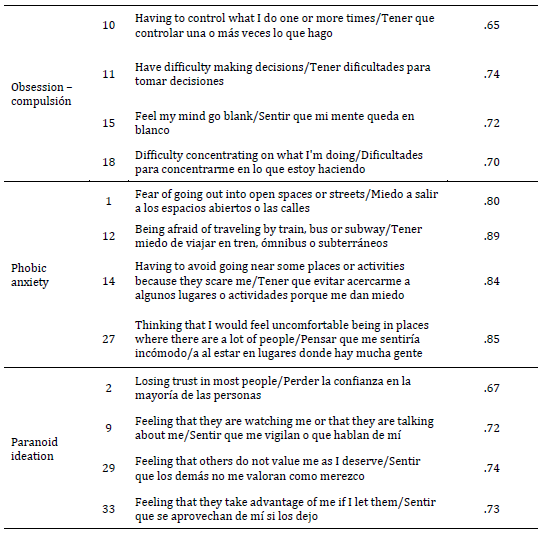
The confirmatory factor analysis showed that the nine correlated factors model exhibited the best-fit indices (Table 1). Considering the 9 correlated factors model, all standardized factor loadings showed acceptable values (Table 2) T3.
Table 1: Goodness-of-fit indexes for the different hypothetical models
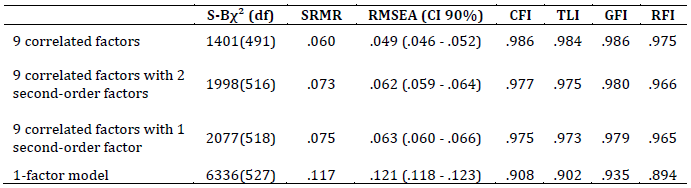
Notes: S-Bχ2: Satorra-Bentler scaled χ 2; df: degrees of freedom; CFI: Comparative Fit Index; TLI: Tucker Lewis fit Index; GFI: Goodness of Fit Index; RFI: Relative Fit Index; RMSEA: Root Mean Square of Approximation; SRMR: Standardized Root Mean Square Residual.
Invariance across gender and region
Invariance was tested considering the nine correlated factors model. Full configural, metric and scalar invariance were supported for gender and region (Table 3).
Table 3: Multiple group confirmatory factor analysis invariance test across gender, education, age and región
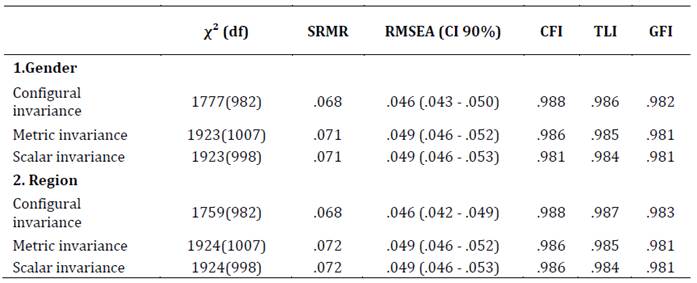
Notes: S-Bχ2: Satorra-Bentler scaled χ 2; df: degrees of freedom; CFI: Comparative Fit Index; TLI: Tucker Lewis fit Index; GFI: Goodness of Fit Index; RMSEA: Root Mean Square of Approximation; SRMR: Standardized Root Mean Square Residual.
Convergent validity
Values of AVE were acceptable for all dimensions except for anxiety (Table 4). Considering Fornell and Larcker (1981) values of .40 or greater could be considered acceptable if composite reliability exceeds .60. Since omega values obey those criteria, all dimensions met the minimum convergent validity criteria.
Reliability
All dimensions offered adequate reliability values except for anxiety and psychoticism (Table 4). In the case of anxiety, it presented categorical alpha and omega values somewhat lower than expected. The psychoticism dimension showed only an acceptable ordinal alpha value.
Population-based norms
T-scores were calculated as normative values for both females and males (Table 5).
Discussion
The present study aimed to provide new psychometric evidence of the Brief Psychological Symptoms Inventory (Vizioli & Crespi, 2020) in adults from Argentina. Regarding factor structure, the nine correlated factors model exhibited the best-fit indices. These results agree with those obtained in the extended version of the instrument (Derogatis, 1977, 1994; Derogatis & Cleary, 1977), as well as in the original abbreviated version (Maruish et al., 1998) and those of investigations carried out in Spanish-speaking countries (Sandín et al., 2008; Vizioli & Crespi, 2020). The standardized loadings of the items were adequate, presenting evidence about the instrument's construct validity. AVE and omega values showed suggested evidence of convergent validity.
Through multigroup confirmatory factor analysis, gender and region invariance were tested considering the nine correlated factors model. The results showed that full configural, metric and scalar invariance were supported for gender and region (Buenos Aires City vs Greater Buenos Aires). The information about the invariance of the instrument is of particular importance since it is a relatively new approach. Although investigations were found that investigated the invariance of different variables using the extended version of the instrument (Arrindell et al., 2006; Preti et al., 2019), there is a field of vacancy concerning the abbreviated version. Invariance is a crucial variable to consider in any useful instrument for psychological assessment. Various investigations have indicated that females are more likely to experience higher symptoms or mental disorders (Cía et al., 2018; Etchevers et al., 2021; Stagnaro et al., 2018) and that there are differences in perceived health by region (Rodríguez Espínola et al., 2019). However, when considering information about differences between groups, it is necessary to be sure that the members of the groups assign the same meaning to the constructs of interest (Putnick & Bornstein, 2016). In this sense, the results of this research can serve as a contribution to future research that intends to make comparative analyses.
Regarding reliability, factors presented adequate reliability values except for psychoticism. Although the values obtained are somewhat lower than those previously reported for this version of the instrument (Vizioli & Crespi, 2020), they are similar to those of previous investigations carried out in Spanish-speaking countries (Alvarado et al., 2012; Holgado-Tello et al., 2019; Sandín et al., 2008). The decrease in the number of items, especially in Psychoticism, could be an explanatory factor for lower reliability coefficients (Cortina, 1993; Hair et al., 2010).
To conclude, the present investigation allowed us to obtain new psychometric evidence about the abbreviated version of the Inventory of Psychological Symptoms. Regarding validity, it has been shown that the model of nine correlated factors is the one that offers the best fit. Adequate evidence of convergent and construct validity of the Inventory has also been obtained. Regarding reliability, the values found are similar to those obtained in other studies carried out in Spanish-speaking countries, which also report lower values in Psychoticism.
Likewise, evidence was obtained about the invariance of the instrument according to gender and region of adults in Argentina. These findings are relevant as they demonstrate the metric equivalence of the inventory in different groups. In summary, it is an appropriate instrument for use in different contexts, particularly in primary care, due to its relatively small number of items (Maruish et al., 1998). It is necessary to mention that in the local environment, there are other instruments, with different characteristics, that are also suitable for measuring psychological symptoms. The local versions of the SA, the SCL-27 and the SCL-90, both offer adequate psychometric properties. Therefore, the choice of instruments depends on the needs and possibilities of the users, whether they are health professionals or researchers.
Concerning the limitations of this research, the use of non-probabilistic sampling allows only a partial generalization of the results obtained. Also, the sample obtained is not balanced for gender and is primarily female. Finally, it is necessary to advance in the study of other sources of validity, such as the external validity of the inventory, based on its correlation with other versions of the instruments and other tests. For example, future research could investigate the correlation between the SA scales and those of the SCL-90 or SCL-27, or even compare the performance and psychometric quality of the instruments in different samples. Likewise, new studies are required with different groups of participants, for example, clinical samples, which provide new evidence on the validity of the inventory in different populations.

