


 Inglés (pdf)
 Articulo en XML
 Referencias del artículo

 Permalink
1. Introduction
In Uruguay, honey remains a prominent component among the products earmarked for export. However, the export market has experienced significant annual fluctuations, contributing to considerable uncertainty for honey producers in recent years1. Given this situation, there is a need to explore tools that facilitate efforts to achieve a more favorable pricing structure for honey production. Simultaneously, there is an opportunity to promote domestic honey consumption by enhancing the perceived value of our honey. Honey gains heightened value when predominantly sourced from a single plant species (monofloral honeys) or from a specific geographical region, referred to as honeys of specific origin (e.g., those from bushes, meadows) 2)(3) 4. The production of monofloral/multifloral honeys depends on various factors, particularly the availability of nectar-producing plants in each region and season. In the case of monofloral honeys, derived from the nectar of a specific plant, their elevated commercial value results from the ability to showcase distinctive chemical and sensory characteristics, including flavor and aroma.
Honey composition depends on the floral origin of the nectar on which the bees feed, as well as on external factors such as climate, environment, and processing conditions5. Floral origin can be very varied, which is reflected in final products that differ both in appearance and in sensory perception and composition. From a phytogeographical point of view, the flora of Uruguay is mostly found in the Pampean province6. The main ecosystems of Uruguay include natural grasslands, forests, wetlands, and coastal ecosystems.
In recent years, the area of grassland has been significantly reduced due to the increase in forestry production, cultivated pastures and annual crops7. One response to the soil deterioration on the part of producers is the planting of certain promising (non-native) legumes to complement pasture8. Native forests, on the other hand, occupy a much smaller portion of the territory than grasslands (3.5%), however, they have a high ecological value due to the number of plant species present9.
In the beekeeping context, this aggregation of ecosystems (bush, grassland) and agroecosystems (afforestation, grasslands improved with legumes) is where apiaries for honey production are installed at different intensities. These ecosystems are neither isolated nor permanent but vary over time and present ecotones that are reflected in the botanical composition of our honeys 10)(11)12)(13) . In turn, the forest dynamics plays a role of great importance, because it is characterized by early flowering (a low flowering period in December-January followed by a new flowering in February-March. During the low flowering period of the bush, melliferous production is mainly based on grasslands (white clover, lotus) or on other annual (e.g. sunflower) or permanent crops (fruit trees, Eucalyptus sp.). In turn, the late flowering of the bush is very useful for the hive to store reserves for the winter14.
Starting from all such considerations, this study demonstrates that the combination of melissopalynology and physicochemical parameters, as a first approximation to achieve a complete characterization, can be a useful tool for discrimination between different kinds of honeys according to their bee species origin.
2. Materials and Methods
2.1 Honey sampling
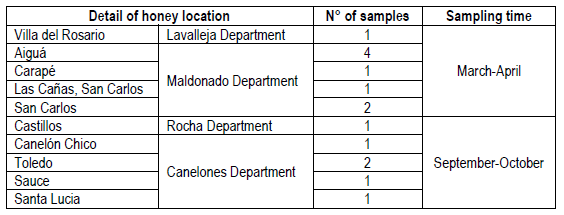
Fifteen honey samples were collected from the Southeastern region of Uruguay. Eight samples were harvested between March and April 2016 from Maldonado department, and one obtained from Lavalleja department (Table 1). A second group of six samples corresponded to honeys harvested during September and October 2016, being five obtained from Canelones and one from Rocha (1 sample) departments (Table 1). All samples were coded and stored in sterile glass jars, kept at 4°C in the dark until analyzed (no longer than two months).
2.2 Melissopalynological analysis
The melissopalynological analysis of the samples was carried out at the Instituto de Ciencias Geológicas, Facultad de Ciencias-Udelar, Montevideo (Uruguay). This analysis was carried out according to the method proposed by Louveaux and others15.
2.3 Physicochemical analysis
All the physicochemical parameters were determined in triplicate according to the Harmonized Methods of the International Honey Commission-IHC16 and the Association of Official Analytical Chemists-AOAC17.
2.3.1 Color and HMF
Color was determined in mm on the Pfund scale according to the US Department of Agriculture classifications (water white: <9, extra white: 9-17, white: 18-34, extra light amber: 35-50, light amber: 51-85, amber: 86-114, dark amber: >114)18.
Hydroxymethyl furfural (HMF) was measured using the method of White19 and honey color was determined using a digital photometer (HANNA HI 96785). The limits of acceptance used were those given by Codex Alimentarius Standard (HMF: ≤40 mg/kg)20.
2.3.2 Diastase activity
This enzyme hydrolyses starch and dextrins resulting in carbohydrates of lower molecular weight. Due to the sensitivity of diastase to heat and storage, its measurement is used as an indicator of honey freshness21. According to national and international regulations, honey must have a minimum diastase activity of 8 on the Gothe scale 16)(22) . For the determination of diastase activity, the method of Schade and others23 was used, which is based on the rate of hydrolysis of a 2% starch solution by diastase enzymes in a buffered solution of honey employing an iodine solution as an indicator, using a spectrophotometric measurement at 660 nm. Diastase activity was calculated as DN (diastase number) as follows24:
DN = (60min / tx)* (0,10/0,01) * (1,0/2,0) = 300/tx
where tx is the reaction time (min) to reach 0.235 absorbance.
2.3.3 Sugar composition
Sugar analysis was performed according to Bogdanov and Baumann25. Briefly, 5 g of honey were mixed with distilled water (40 mL) and transferred to a 100 mL volumetric flask and then mixed with methanol. Next, 10 mL of this dissolution was filtered through a 0.20-μm cellulose acetate membrane prior to HPLC analysis. The determination of the sugars (fructose, glucose, sucrose, maltose and turanose) was performed using a LC 20-10 series Shimadzu chromatograph equipped with a refractive index detector operated at 30 °C and a SUPELCOSIL™ LC-NH2 HPLC Column (5 μm particle size, 250 × 4.6 mm). Acetonitrile (80%) in water was used as the mobile phase (flow rate 1.3 mL/min). The HPLC sample peaks were identified by comparing the retention times obtained from standards. Duplicate injections were performed, and the average peak areas were used for the quantification.
2.3.4 Mineral content
Na, K, Ca and Mg were analysed by atomic absorption spectrometry with acetylene air flame using an Analyst 200 spectrometer (PerkinElmer, Inc., MA, USA). In order to minimize organic matrix effects, a microwave-assisted sample digestion was performed according to Chudzinska and Baralkiewicz26 before analysis. In brief, the heating program consisted of a 20 min ramp up to 120 °C, holding at that temperature for 20 min, followed by a 20 min ramp from 120 to 170 °C, and remaining 15 min at that temperature.
2.4 Statistical analysis
Principal components analysis (PCA) was performed using the InfoStat software27.
3. Results
3.1 Melissopalynological analysis
Table 2 shows the results of the palynological analysis of honeys and its typification (monofloral or polyfloral) according to the percentage of pollen observed. Eight of the fifteen honey samples were classified as monofloral, where five of them were from native plants (SMm03, Sbm04, Sbm05, Sbm06 and Sbm09), and three were originated from introduced plants (Lm01, Lm13, Lm14). The remaining seven honey samples were found to be polyfloral. Among the native monofloral honeys the predominant pollen found was of Scutia buxifolia in four of them, and one of Schinus molle. The corresponding three non-native monoflorals were found to be Lotus sp, while the remaining seven polyfloral samples showed a predominance of Eucalyptus sp. pollen.
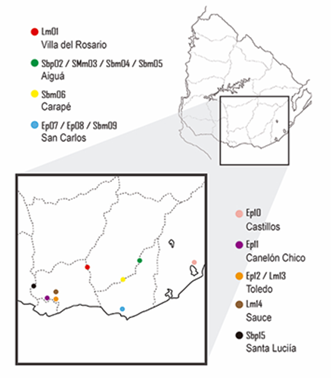
Figure 1 shows the geographic distribution of the honey samples classified according the melissopalynological analysis as presented in Table 2.
Table 2: Main pollen types in the evaluated honeys
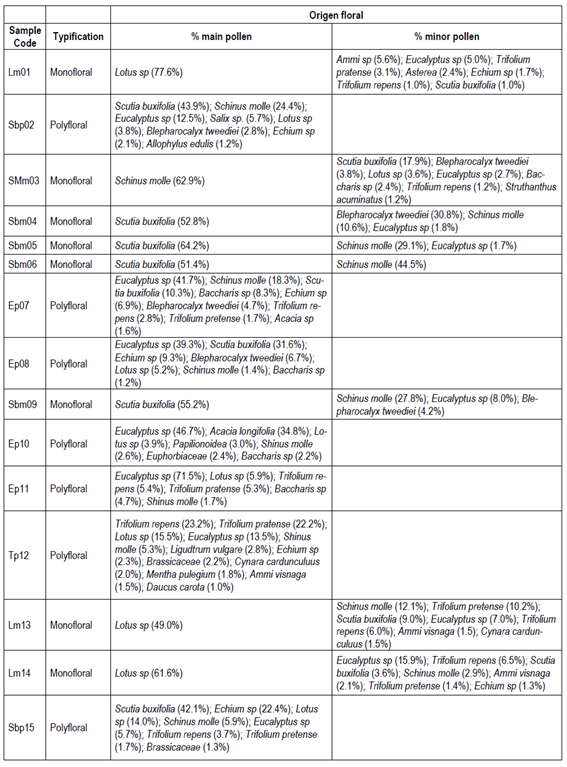
Lm, Lotus sp. Monofloral; Sbp, Scutia buxifolia polyfloral; SMm, Schinus molle monofloral; Sbm, Scutia buxifolia monofloral; Ep, Eucalyptus sp. polyfloral; Tp, Trifolium polyfloral. The number corresponds to the order of sample entry. Lm01 (Villa del Rosario), Sbp02 (Aiguá), SMm03 (Aiguá), Sbm04 (Aiguá), Sbm05 (Aiguá), Sbm06 (Carapé), Ep07 (Las Cañas, San Carlos), Ep08 (San Carlos), Sbm09 (San Carlos), Ep10 (Castillos), Ep11 (Canelón Chico), Tp12 (Toledo), Lm13 (Toledo), Lm14 (Sauce), Sbp15 (Santa Lucía)
3.2 Physicochemical analysis
Table 3 shows the results obtained from the physicochemical analysis of the honey samples.
Table 3: Physicochemical properties of honey samples
| Sample Code | pH | Free Acidity (meq/kg) | Moisture (%) | Ash (%) | Diastase activity | HMF (mg/kg) | EC (mS/cm) | *Pfund Color (mm) |
| Lm01 | 4.0 | 21.5 | 17.6 | 0.06 | 48.4 | 0 | 0.51 | 48 |
| Sbp02 | 5.6 | 12.0 | 18.4 | 0.50 | 26.6 | 0 | 1.32 | 99 |
| SMm03 | 4.7 | 19.0 | 19.2 | 0.38 | 45.2 | 0 | 1.06 | 98 |
| Sbm04 | 4.9 | 18.5 | 18.4 | 0.46 | 33.0 | 0 | 1.27 | 112 |
| Sbm05 | 6.1 | 7.5 | 18.8 | 0.49 | 32.0 | 0 | 1.44 | 102 |
| Sbm06 | 5.2 | 7.0 | 18.8 | 0.44 | 26.4 | 0 | 1.17 | 92 |
| Ep07 | 5.5 | 13.5 | 18.8 | 0.46 | 22.7 | 0 | 1.38 | 118 |
| Ep08 | 4.8 | 14.5 | 17.6 | 0.57 | 17.5 | 0 | 1.72 | 109 |
| Sbm09 | 5.8 | 8.0 | 17.8 | 0.45 | 15.1 | 0 | 1.35 | 92 |
| Ep10 | 4.2 | 18.5 | 15,0 | 0.20 | 14.7 | 0 | 1.03 | 71 |
| Ep11 | 3.6 | 29.5 | 17.4 | 0.19 | 18.3 | 15.2 | 0.63 | 65 |
| Tp12 | 3.5 | 30.0 | 17.2 | 0.11 | 24.8 | 8.6 | 0.48 | 44 |
| Lm13 | 3.7 | 24.5 | 15 | 0.15 | 22.7 | 7.6 | 0.44 | 50 |
| Lm14 | 3.5 | 36.5 | 16.8 | 0.08 | 24.9 | 8.5 | 0.49 | 60 |
| Sbp15 | 4.4 | 17.5 | 17.4 | 0.39 | n.d. | 1.0 | 1.08 | 145 |
| min | 3.5 | 7.0 | 15.0 | 0.10 | 14.7 | 0.0 | 0.44 | 44 |
| max | 6.1 | 36.5 | 19.2 | 0.60 | 48.4 | 15.2 | 1.72 | 145 |
Codex Alimentarius Standard (moisture: ≤ 20%, Pfund color: 0-150 mm; EC: ≤0.8 mS/cm; pH: 3.4-6.1; FA: ≤50 meq/kg; HMF: ≤40 mg/kg; DN: ≥8)20.
3.2.1 pH and acidity
The pH values ranged from 3.5 to 6.1, which are within the Food Codex standard limits, which establishes the pH limit for honey between 3.4 and 6.120. The pH values are important for honey extraction and storage as it influence its texture, stability, and shelf life28, being also low enough to inhibit the development of microorganisms 29)(30) .
Acidity values ranged from 7 to 36.5 meq/kg within the maximum value accepted of 50 meq/kg., while the moisture percentage ranged between 15.0 and 19.2%, a value that is below the maximum limit established of 20% in the Codex standard for honey20.
3.2.2 HMF
HMF values were all below the maximum allowable limit of 40 mg/kg, indicating that the honeys were not subjected to heat treatment after being harvested. In addition, these low HMF values also agree with the diastase activity values found not less than 8 Schade units20.
3.2.3 Ash and conductivity
As for the ash percentage, the values obtained were below the maximum limit established (0.6%) in the Uruguayan directives for flower honey22. This result is also indicative of the cleanliness of the honey samples and the absence of adulteration with molasses31.
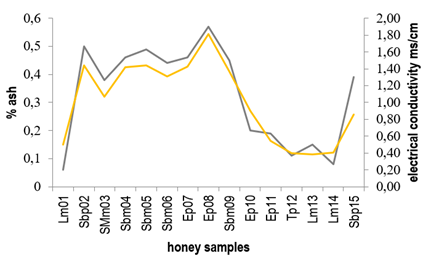
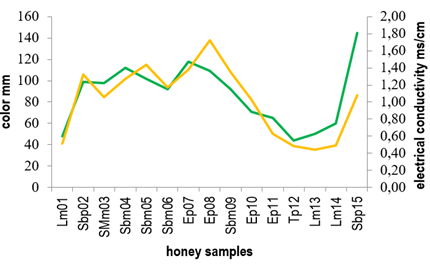
Conductivity values ranged from 0.44 to 1.70 ms/cm, where only 5 of the 15 honey samples showed values below the maximum limit (0.8 ms/cm) defined by the Codex Alimentarius20. Generally, both conductivity and ash content are related to the mineral content in honey 32)(33) and so honeys with higher ash percentage presented higher conductivity values. Figure 2 shows the relationship between ash content and electrical conductivity found for the honeys here studied.
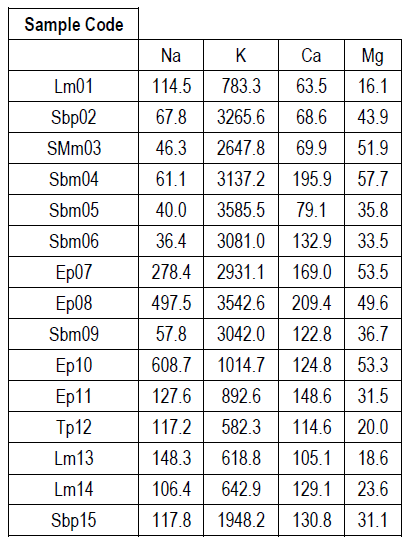
3.2.4. Minerals
Table 4 shows the mineral content of the honeys studied. The most abundant mineral in all the honey samples was potassium (K), ranging in values between 582.3 and 3585.5 mg/kg honey; followed by sodium (Na) or calcium (Ca), depending on the honey considered, with values between 36.4-608.7 and 63.5-209.4 mg/kg honey, respectively. For all honeys the least abundant mineral was magnesium (Mg), with values between 16.1-57.7 mg/kg honey.
In brief, the relationship between mineral content, ash and conductivity in honey is because the minerals present in honey contribute to both the mineral content and the ash, and these minerals are also responsible for its ability to conduct electricity, which affects its electrical conductivity.
3.2.5 Color
As for color, honeys presented a wide range of values on the Pfund scale ranging from 48 to 145 mm (extra light amber to dark amber, respectively).
Samples Sbm04, Sbm05, Sbm06 and Sbm09 defined as Scutia buxifolia monofloral and SMm03 (Shinus molle monofloral) presented conductivity values higher than those established by Codex Alimentarius of 0.8 ms/cm20 and were amber in color. Instead, Lotus monofloral honeys (Lm01, Lm13, Lm14) showed conductivity values below the maximum limit established by Codex Alimentarius (0.8 ms/cm)20, while their color ranged between light amber and extra light.
Figure 3 shows the relationship between electrical conductivity and color for the honeys studied. Similar results were previously reported correlating high conductivity values to the dark color of the honeys 21)(34)35)(36) 37.
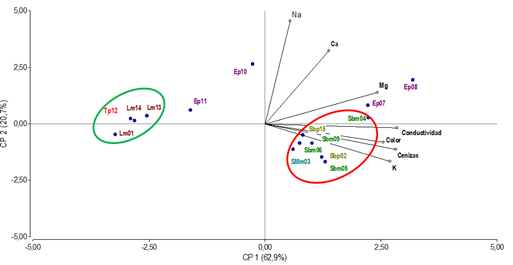
To confirm whether the relationship between mineral composition and parameters such as color, electrical conductivity and ash content are factors capable of differentiating the honey samples studied, multivariate statistical tools were used to perform a principal component analysis (PCA) (Figure 4).
3.2.6 Sugar profile
In Table 5 the content of sugars found in each honey sample is shown. Fructose and glucose were the main sugars analyzed followed by the disaccharide maltose, sucrose and turanose. The primary sugars found in honey are fructose and glucose. These sugars, along with the sucrose content, collectively serve as key quality indicators for honeys within the European Union38.
Table 5: Analysis of sugar content (%) present in honey samples
| Sample Code | Fructose | Glucose | Sucrose | Turanose | Maltose | F+G* | F/G | G/W |
| Lm01 | 39.5 | 33.4 | 2.0 | 0.9 | 2.7 | 72.9 | 1.2 | 1.9 |
| Sbp02 | 36.4 | 29.2 | 3.1 | 3.0 | 3.8 | 65.6 | 1.2 | 1.6 |
| SMm03 | 36.9 | 29.9 | 2.9 | 1.9 | 3.4 | 66.8 | 1.2 | 1.6 |
| Sbm04 | 37.0 | 29.3 | 2.9 | 2.2 | 3.0 | 66.3 | 1.3 | 1.6 |
| Sbm05 | 36.2 | 28.9 | 2.8 | 2.7 | 3.8 | 65.1 | 1.3 | 1.5 |
| Sbm06 | 36.1 | 28.9 | 3.2 | 2.8 | 3.9 | 65.0 | 1.2 | 1.5 |
| Ep07 | 36.5 | 31.4 | 3.1 | 2.9 | 3.7 | 67.9 | 1.2 | 1.7 |
| Ep08 | 38.1 | 29.2 | 3.4 | 2.9 | 4.2 | 67.3 | 1.3 | 1.7 |
| Sbm09 | 36.2 | 28.9 | 3.1 | 3.0 | 4.5 | 65.1 | 1.3 | 1.6 |
| Ep10 | 40.4 | 36.6 | 2.5 | 1.1 | 1.7 | 77.0 | 1.1 | 2.4 |
| Ep11 | 40.8 | 30.8 | 2.1 | 0.9 | 2.4 | 71.6 | 1.3 | 1.8 |
| Tp12 | 42.5 | 27.9 | 0.4 | 1.8 | 4.5 | 70.4 | 1.5 | 1.6 |
| Lm13 | 40.0 | 31.7 | 0.9 | 2.4 | 1.8 | 71.7 | 1.3 | 2.1 |
| Lm14 | 42.1 | 29.1 | 2.3 | 1.2 | 2.0 | 71.2 | 1.4 | 1.7 |
| Sbp15 | 37.4 | 28.8 | 2.8 | 2.3 | 3.9 | 66.2 | 1.3 | 1.7 |
| min | 36.1 | 27.9 | 0.4 | 0.9 | 1.7 | 65.0 | 1.10 | 1.5 |
| max | 42.5 | 36.6 | 3.4 | 3.0 | 4.5 | 77.0 | 1.53 | 2.4 |
*F, fructose; G, glucose; W, water
4. Discussion
Melissopalynological analysis plays a fundamental role for monofloral honeys marketing, where at least 45% of the total number of pollen grains belong to the same plant species. There are exceptions, such as the case of Eucalyptus honey, in which its pollen grains are over-represented, so that to be considered monofloral it must contain at least 75% of pollen from this genus37. The opposite situation is represented by citrus honey, where pollen grains from citrus are underrepresented, so that a presence of this type of pollen between 10-20% is sufficient to consider citrus honeys as monofloral 15)(39) .
The results obtained on the pollen identification for the honeys evaluated agreed with previous works reported in the literature on the taxa of the most common plant communities in the Uruguayan regions considered 12)(13) 34.
When evaluating the results of the physicochemical and mineral content analyses, it was found that mineral values agree with those reported in the literature, where K is the most abundant mineral (about 80% of the total metals determined), followed in smaller proportion by Na or Ca, and lastly Mg 31)(40) . Moreover, and as previously reported 31)(32)33)(41) honeys with higher mineral content show darker colors, higher ash content and higher conductivity values.
A statistical treatment using Principal Component Analysis (PCA) applied to the results obtained from physicochemical and mineral analyses showed that the first two components explain more than 83% of the variability of the system. The samples distribution through the projected variables (minerals, electrical conductivity, ash, and color) demonstrates that those are factors capable of differentiating the honey samples studied.
Non-native monofloral Lotus spp. honeys (Lm01, Lm13, Lm14) and polyfloral honeys with predominance of Trifolium repens and Trifolium pratense (Tp12) were grouped (green circle) towards negative values of PC1, and presented light colors, low ash content, low conductivity values and low mineral content.
PC1 also separated, towards positive values (red circle), the Scutia buxifolia native monofloral honeys (Sbm04, Sbm05, Sbm06, Sbm09), Schinus molle (SMm03) and polyfloral honeys with predominance of Scutia buxifolia (Sbp02, Sbp15), which presented dark colors, high ash content, higher conductivity values and high metal content.
Meanwhile, samples Ep07, Ep08, Ep10 and Ep11 identified as polyfloral honeys with a higher predominance of Eucalyptus were distributed in this analysis according to their less abundant pollen content. Ep07 and Ep08, presenting less Eucalyptus pollen content with predominance of Schinus molle and Scutia buxifolia, respectively, were in the PC1 towards positive values close to the native honeys, also presenting dark color, high ash content, higher conductivity value and high metal content. Samples Ep10 and Ep11, also presenting Eucalyptus pollen content, less pollen content but with Acacia longifolia and Lotus sp predominance, respectively, located towards negative values of PC1, next to the non-native honeys that presented light colors, low ash content and low metal content.
The results obtained from the study of sugar profiles confirm that all the honeys analyzed pertain to flower honeys type, as the combined levels of fructose and glucose (F+G) were at least 65%, and sucrose content did not exceed 5% for flower honey38. The crystallization time of honey primarily depends on the relative proportions of fructose to glucose and the ratio of glucose to water42.
Lower solubility of glucose in water than of fructose explains the F/G ratio has been used to predict the honey tendency to crystallize43. F/G ratio below 1 indicates fast crystallization, while the ratio exceeding 1.3 indicates slow crystallization44. The data obtained showed honeys Tp12 and Lm14 presented F/G ratio <1.3, so they can be considered slow crystallization honeys, while the others presented F/G values between the limits of fast and slow crystallization.
Moisture content can affect the physical properties of honey (viscosity, crystallization), so the Glucose/Moisture (G/W) ratio could be also a useful indicator to predict honey crystallization. Honey crystallization is slow when ratio glucose/G/W is less than 1.7, but it is rapid when the ratio is greater than 2 39)(40) . According with our results, only the honeys samples Ep10 and Lm13 showed a ratio over 2 and so they can present faster crystallization.
5. Conclusions
The results found in this work contribute to the identification of honeys and to initiate a characterization work for Uruguayan honey valorization. Honey, being a highly complex mixture, exhibits a unique composition in every batch, making each one distinct from the other. Moreover, variations in botanical sources contribute to differences in both appearance and composition among honeys derived from native flora. Even within the same floral category, honey composition can vary significantly due to geographical location, seasonal influences, bee species, harvesting methods, storage conditions, and processing techniques. As melissopalynology remains the sole validated method for determining the botanical origin of honey, it is not without its limitations.
Studies such as the one presented here contribute with valuable information for comparative purposes, thereby aiding in the quest for improved methodologies in this field. Focus has been put on the characterization of honeys that can be classified as monofloral from native plants, where the results suggest that these honeys are in accordance with the quality standards established by national and international standards.

