


 Inglés (pdf)
 Articulo en XML
 Referencias del artículo

 Permalink
1. Introduction
Surface water sources such as lakes, rivers and reservoirs are showing fast changes all around the world, and one in five river basins show considerable fluctuations in surface water levels in the last 5 years. Extreme climatic events cause water to be more scarce and more unpredictable. Among the 2030 Agenda for Sustainable Development, the Sustainable Development Goal (SDG) 6 seeks to support countries in monitoring water- and sanitation-related issues to assure water availability, integrated management, and sanitation1.
Climate change events have reached Alto Valle of Río Negro and Neuquén (AVRNyN) as climatic variability, extreme climatic events occurrence, and water scarcity 2)(3)4)(5) . Extreme climatic events include the diminution of rainfall and snowfall in the high mountains, causing a decrease in the river flows of the basin that provides irrigation water to the area. Water scarcity has reached a 13-year period between 2010 and 2023, affecting the basin water balance. Irrigation water management in arid regions is a relevant aspect for the development and maintenance of sustainable agro-ecosystems and water resources preservation.
Irrigation performance improvement is one of the challenges of integrated water resource management. The agriculture sector had the highest increase in water resources efficiency use (20%) since 2015, compared to the industry (13%) and service sectors (0.3%)6. Irrigation efficiency has been the most used approach to assess irrigation performance. The traditional methodology to evaluate field irrigation efficiency considers aspects of the field, the soil, and the irrigation practice, focused on a field scale7. However, irrigation efficiency assessment is a better indicator when it considers a basin perspective and regional characteristics of the environment8.
AVRNyN is a 100,000 ha irrigated region located in the Argentinian arid diagonal. Most of the area is surface irrigated and the main crops are pip and stone fruits, with 37,837 ha planted9. Water table raise is a consequence of the irrigation system operation in AVRNyN. It is mainly caused by the losses of the distribution channels and by the low field irrigation efficiency, and occasionally affected by river flows 10)(11) 12. In AVRNyN, capillary rise as a consequence of the shallow water table negatively affects irrigation efficiency performance. Additionally, according to the previous evaluations developed, irrigation efficiency can be improved by modifying some management aspects such as irrigation extent and frequency 13)(14) .
Although irrigation efficiency standards have been largely developed and studied in different locations and conditions, simulation models do not consider capillary rise as a relevant factor 15)(16) 17. In AVRNyN the existence of a shallow water table modifies the soil water balance. As the water table has a seasonal variation, the capillary rise contribution to the soil water balance is not uniform throughout the year.
The aim of this study was to evaluate the effect of capillary rise on surface irrigation performance during a growing season in a pear orchard, and to calculate water use efficiency and water productivity for local conditions.
2. Materials and methods
Capillary rise was estimated between September 2020 and April 2021. Irrigation sheets were calculated considering capillary rise. Water use efficiency and water productivity were obtained.
2.1 Experimental plot
This is a case study and was carried out in a pear orchard located at INTA Experimental Station (39°01’40” S; 67°44’35” W, mean elevation 240 m, General Roca, Argentina). The 1.8 ha study plot was planted in 2003 with Bartlett (Pyrus communis Williams Bon Chretien) pears on seedling rootstock. The orchard rows have West-East orientation and less than 0.05% slope in the same direction, suitable for surface irrigation. Soil profile is heterogeneous, medium-fine textured with low organic matter, slightly alkaline and non-saline or sodic. Tall fescue (Festuca arundinacea Schreber) and other spontaneous vegetation cover the alleys. To the west of the plot, there is a poplar windbreak; to the east and south side, there are other pear plots. Between-row spacing is 4 m and the intra-row tree spacing is 2 m. Trees are trained as modified trellis (palmette).
2.2 Irrigation performance
Field work was carried out to obtain infiltration, soil moisture, flow capacity inflow, irrigation extent, size of the irrigated plot (length, width, and number of simultaneously irrigated rows), and longitudinal slope of the plot. Seven irrigations were performed during the season; three of them were fully evaluated with the following methodology. For the rest of the irrigation performances an average gross sheet was estimated. Field irrigation efficiency was evaluated according to the standards of the American Society of Agricultural Engineering18 and Walker and Skogerboe15, adapted and described by Morabito and Schilardi19.
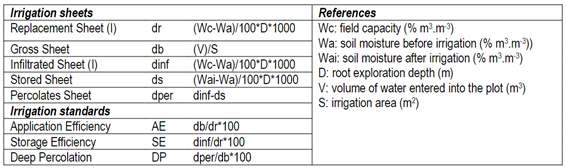
Performance indicators were obtained from irrigation sheets and water volumes. Application efficiency (AE) is defined as the quotient between the volume of water stored in the soil profile explored by the roots of the pear trees and the volume of water entered into the irrigated plot. Storage efficiency (SE) is represented by the sheet stored in the soil profile after an irrigation event with respect to the sheet that needs to be stored. Deep percolation (DP) is the ratio between percolated water sheet and applied irrigation sheet. A summary of irrigation sheets and irrigation standards is presented in Table 1.
2.3 Capillary rise and deficit aeration
Capillary rise (CR) and Deficit aeration (DA) were estimated with UPFLOW software20. The information used was environmental conditions, water table level (WTL), volumetric water content (VWC) in the topsoil, crop evapotranspiration (ETc), and soil texture, among others. To estimate crop water demand, ETo was obtained from the weather station located in the experimental station with Penman-Monteith methodology and local crop coefficients (kc) were used 21)(22) 23. A steady state condition was assumed, so that the calculated flux was in equilibrium with the crop (ETc) demand and the soil water conditions in the topsoil20. WTL was measured weekly with an acoustic probe in an opened piezometer in accordance with the methodology described by Mañueco13. Frequency domain reflectometry (FDR) soil moisture sensors (ECH2O EC-5, METER Group, Inc., USA) were installed at 0.20, 0.40, and 0.60 m depth to measure volumetric water content of the soil profile. All sensors recorded hourly to a data logger, and data was presented as daily and 10-day media.
Soil water content at field capacity was determined by the soil moisture sensors records. With the hourly data, water outflow curves were made starting with the irrigation day and observing the point in which the excess water was drained, determined by the inflection point and the rate of downward movement decreased, within the 48-72 h22. Water content at field capacity (θFC) was thus determined and water content at wilting point (θWP) was estimated using texture reference tables24. Readily available water (RAW) was calculated considering a p factor of 0.524. The active roots of the pear trees were located between 0.2 and 1 m soil depth and irrigation sheets were calculated using Z=0.8 m.
2.4 Water use efficiency and water productivity
Water use efficiency (WUE) and water productivity (WP) were calculated using yield and irrigation sheets applied and crop water demand, respectively, as considered by Caviglia and others25, Van Halsema and Vincent7, and Neffen26. To obtain yield, trees were harvested from the last week of January to the first week of February to collect all the fruits that reached commercial size (>65 mm of fruit diameter).
Water productivity is the ratio between the product or accumulated biomass and the water consumed. This approach supposes that sub-optimal yields are due to lack of irrigation, and considers water as any other input for the crop and can be transformed into an increasing yield. In terms of the pear production process, it can be obtained as:

Water use efficiency considers a water management perspective. It can be calculated as the ratio between the product or accumulated biomass and the water available or applied (db=gross sheet). It can be calculated as:

3. Results
Volumetric water content (VWC) of the soil profile was graphed from the records of the soil moisture sensors at 0.20, 0.40, and 0.6 m depth. The difference between Field capacity (FC) and Wilting point (WP) is the Total available water (TAW) of the soil profile. Readily available water (RAW) was set as 50% of the TAW. The records from the sensors threw back the pattern of the irrigation scheme behavior (Figure 1).
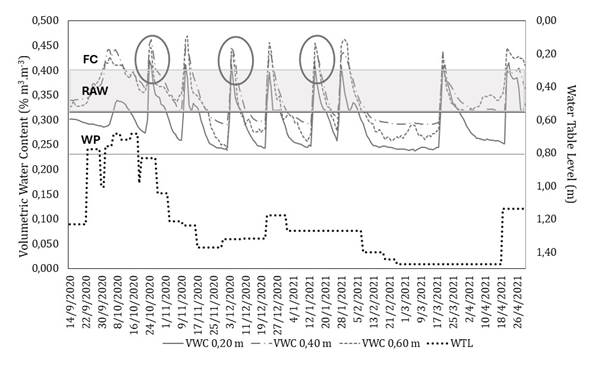
Figure 1: Volumetric water content of the soil and water table level. The circles indicate the irrigation efficiency evaluation moments in October, December, and January
Water table level (WTL) was shallower in spring than in the rest of the season. Average depth in early spring fluctuated between 0.70-1.20 m. Soil water content of the deeper sensors (0.4 and 0.6 m) was higher than soil water content at 0.2 m, especially during the early spring when WTL was shallower. During that period, soil water content was over the Field capacity (FC) threshold, indicating a waterlogged condition due to capillary rise (Figure 1).
Soil water balance for a pear crop is presented in Table 2. Estimating irrigation needs based on daily or monthly average values is insufficient to adjust the surface irrigation schedule. Therefore, the average of 10-day periods, 3 periods each month, was used. The water demand for the growing season expressed as crop evapotranspiration (ETc) was 1036 mm. According to the capillary rise estimation, the water table contribution was 436 mm, which represents 42% of the ETc. However, as WTL has a seasonal pattern, CR is proportionally higher in spring, when compared to ETc. In this period, the poor aeration values (86 and 74%) calculated with the Upflow software (Table 2) and the soil moisture values recorded by FDR sensors (Figure 1) show a waterlogged condition.
Table 2: Soil-crop water balance and Capillary rise quantification for 2020-2021 seasons. Months were divided into three equal periods to schedule surface irrigation. VWC and ETc are the average of each period. Capillary rise and Deficient aeration were the results of the Upflow simulation software
| Year | 10-day period | VWC 0.20 m (m 3 m -3 ) | ETc (mm day -1 ) | Capillary rise q (mm day -1 ) | Deficient aeration (%) |
| 2020 | Sep-03 | 0.291 | 2.2 | 2.2 | 16 |
| Oct-01 | 0.312 | 1.8 | 1.8 | 86 | |
| Oct-02 | 0.307 | 2.5 | 2.5 | 74 | |
| Oct-03 | 0.341 | 2.5 | 2.4 | 12 | |
| Nov-01 | 0.284 | 3.2 | 2.1 | 4 | |
| Nov-02 | 0.332 | 3.3 | 1.8 | 0 | |
| Nov-03 | 0.250 | 4.0 | 1.9 | 0 | |
| Dec-01 | 0.320 | 7.0 | 2.0 | 1 | |
| Dec-02 | 0.261 | 6.6 | 2.0 | 1 | |
| Dec-03 | 0.319 | 7.9 | 2.1 | 5 | |
| 2021 | Jan-01 | 0.255 | 8.5 | 2.1 | 4 |
| Jan-02 | 0.318 | 8.4 | 2.0 | 4 | |
| Jan-03 | 0.316 | 7.8 | 2.0 | 4 | |
| Feb-01 | 0.308 | 6.3 | 1.8 | 0 | |
| Feb-02 | 0.249 | 6.5 | 1.8 | 0 | |
| Feb-03 | 0.242 | 6.5 | 1.8 | 0 | |
| Mar-01 | 0.240 | 3.9 | 1.8 | 0 | |
| Mar-02 | 0.268 | 4.0 | 1.8 | 0 | |
| Mar-03 | 0.335 | 3.7 | 1.7 | 0 | |
| Apr-01 | 0.268 | 2.6 | 1.8 | 0 | |
| Apr-02 | 0.257 | 2.5 | 2.3 | 7 | |
| Apr-03 | 0.369 | 1.9 | 1.9 | 8 | |
| 1036 | 436 |
Irrigation performance intends to evaluate the water application practices in terms of well-timing and sufficiency. To standardize that evaluation, irrigation sheets and irrigation standards were obtained. Seven irrigations were done during the growing season, and three of them were evaluated with the complete evaluation efficiency methodology (Figure 1 and Table 3). The gross sheet estimated for the rest of the irrigation performances was 150 mm each. Further, the gross sheet for the season was 1164 mm.
Table 3: Irrigation sheets (mm) and irrigation standards (%) of the three irrigations evaluated in October, December, and January in a surface irrigated pear crop
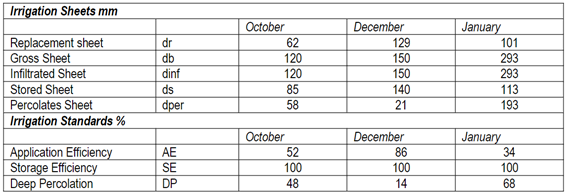
Thresholds defined by Roscher27 were used to assess irrigation performance for surface irrigation (see Table S1 in Supplementary material). Application efficiency (AE) compares gross sheet and replacement sheet. Irrigation events of October, December and January reached an application efficiency of 52%, 86% and 34%, respectively (Table 3). The difference between the gross sheet and the replacement sheet resulted in the bad managed performance observed in October and January. Thus, AE calculated for irrigation events of December can be qualified as “good managed”, whereas the October and January irrigation performances were “bad managed”27.
Storage efficiency (SE) obtained in all three cases exceeded 100%, suggesting that the irrigation practices were sufficient to replenish the necessary water in the soil profile to reach the state of field capacity. Deep percolation (DP) was 48%, 14% and 68% in October, December, and January, respectively, showing an excess of applied water (Table 3).
In October, irrigation sheets turned out to be higher than needed, as shown in Figure 1, with the waterlogged soil water content. Capillary contribution negatively affected irrigation efficiency, pointing out a badly-timed irrigation, not needed yet, or needed but with a lower sheet. In January, the percolation sheet was twice the replacement sheet, indicating that irrigation time was too long, and a large amount of water was lost by percolation.
Water productivity (WP) was calculated using the yield of the pear crop and the crop evapotranspiration of the season (WP=38000 kg/1036 mm), resulting in 37 kg.mm-1. Water use efficiency (WUE) was calculated with the sum of the sheets (db) of the seven irrigations applied during the season (WUEdb=38000 kg/1164 mm). The result of this theoretical approach is WUEdb=32 kg.mm -1. When CR during October´s irrigation was quantified, irrigation schedule could be improved and WUE increased up to 38.8 kg.mm-1.
4. Discussion
The result of this study shows that capillary rise significantly increases soil moisture, especially in spring, covering the pear crop water needs during that period. Therefore, it might be possible to decrease gross sheets or even dispose of spring irrigation. Additionally, WUEdb might also be enhanced by improving irrigation performance. This is in accordance with other regional results 13)(22) 28.
Water table contribution represents 42% of the total ETc, but it represents the whole ETc of the early spring (September and October). This situation caused a waterlogged condition in the soil profile, confirmed by soil moisture sensors and deficient aeration percentage. The same situation was reported by Galeazzi and Aruani28, where 36% of the crop water demand was complemented by groundwater8. Moreover, the influence of CR in the root zone was previously estimated in one season in a pear orchard22 and during three seasons in a cherry orchard13.
According to Roscher27, the irrigation event of December can be qualified as “good managed” as the threshold was above 75%. The irrigation performances of October and January were “bad managed”, as thresholds were below 60%. Application efficiency depends on different factors; in this study, “bad managed” irrigation in October occurred because the soil was waterlogged. Whereas “bad managed” irrigation in January can be explained by the gross sheet that was three times higher than the replacement sheet needed. Low irrigation performance is usually associated with the irrigation method and management 7)(8) . Long irrigations are related to low efficiency performances and can be easily improved by adjusting plot irrigation management 29)(30) . However, adjusting irrigation schedules according to soil water content is an appropriate tool to improve irrigation efficiency.
Generally, an improvement of WUE is associated to deficit irrigation and yield reduction 31)(32)33)(34) . Similar values of WUE (28.6 and 31.9 kg.mm-1) were calculated in two consecutive years in pear trees without deficit irrigation, and they improve WUE by different levels of deficit irrigation35. In this study, WUE was 32 kg.mm-1 and the possibility of improving WUE (38.8 kg.mm-1) is associated with the supply of water due to capillary rise in the root zone. This supports the idea that crop water requirement is satisfied not only by irrigation, but also by groundwater contribution 8)(22) 27, allowing to space irrigations in spring without diminishing yield. WUE can be improved even over WP, as the gross sheet needed to be provided by irrigation if CR is quantified and considered into the water balance could be lower than ETc.
5. Conclusions
Irrigation efficiency assessments enabled to review structural issues as drainage systems and irrigation domain. The adjustment of the irrigation frequency in spring would positively impact irrigation performance, considering the water table capillary impute. In this study, the influence of the capillary rise in soil moisture and consequently in irrigation efficiency was quantified and analyzed. Considering a field scale, irrigation schedules can be re-arranged to consider soil moisture and capillary rise and apply the necessary water sheets for each crop development stage and water demand. From a basin perspective, irrigation water requirements are not only the water needed for a specific crop, but also a contribution from the irrigation system to the landscape.
Irrigation planning aims to ensure that irrigation is sufficient, well-timed, and uniform. However, a field perspective is insufficient, and a basin perspective is needed to obtain integral and long-lasting improvements. Thus, improving irrigation performance and water use efficiency enables a sustainable water management strategy in pear production. This plays a significant role in ensuring sustainable water use and maintaining productivity of crops.

