


Servicios Personalizados
Revista

Articulo
 texto en
  Inglés (pdf)
 Articulo en XML
 Referencias del artículo
Links relacionados
Compartir

 Permalink
Ciencias Psicológicas
versión impresa ISSN 1688-4094versión On-line ISSN 1688-4221
Cienc. Psicol. vol.18 no.1 Montevideo 2024 Epub 01-Jun-2024
https://doi.org/10.22235/cp.v18i1.3498
Original Articles
Adaptation and Analysis of the Internal Structure of the Sense of Belonging at University Scale (SBUS) in Peruvian Students
1
 http://orcid.org/0000-0002-4166-7210
2
http://orcid.org/0000-0003-4197-1906
1 Universidad Peruana de Ciencias Aplicadas, Perú, jossue.correa@upc.pe
2 Universidad Peruana de Ciencias Aplicadas, Perú
3 Universidad Autónoma de Barcelona, España
4 Universidad Marcelino Champagnat, Peú
The sense of belonging refers to the experience of participation in a system or environment in such a way that each member feels an integral part of that system. This attribute is of interest in different educational environments of different levels, however, there are no measures that allow its correct measurement. The purpose of the study was to adapt and analyze the internal structure of the Sense of Belonging Scale in Peruvian university students (SBUS). For this, we worked with a convenience sample made up of 827 university students, divided into two groups, one of 220 students (68.6 % women) with an average age equal to 21.68 years (SD = 4.87), with which the exploratory factorial analysis was carried out. The second group consisted of a total of 607 participants (69.7 % women) with an average age of 21.28 (SD = 4.21) years, with which confirmatory factor analyzes were performed. The results show the linguistic adaptation, appreciating an adequate inter-observer agreement (RVC > .70). The exploratory factor analysis suggests a two-factor structure (χ2 = 646.750; df = 36.00; p < .001) that explains 41.2 % of the variance; this structure was corroborated by a confirmatory factor analysis, which reached adequate fit indices (CFI = .998; TLI = .996; RMSEA = .048). The reliability of the scale was determined by internal consistency, finding omega coefficients ranging between .665 and .929. In summary, the SBUS is an instrument with adequate evidence of validity and reliability to measure the sense of belonging.
Keywords: sense of belonging; university students; confirmatory factor analysis; validity; education
El sentido de pertenencia hace referencia a la experiencia de participación en un sistema o entorno de tal manera que cada miembro se sienta parte de ese sistema. Este atributo es de interés en el ámbito educativo de distintos niveles, sin embargo, no se cuenta con un instrumento que permita su medición en el medio. El propósito del estudio fue adaptar y analizar la estructura interna de la Escala de Sentido de Pertenencia en universitarios peruanos (ESPU). Se trabajó con una muestra por conveniencia compuesta por 827 universitarios, dividida en dos grupos uno de 220 estudiantes (68.6 % mujeres) con una edad promedio de 21.68 años (DE = 4.87), con la cual se realizó el análisis factorial exploratorio. El segundo grupo estuvo conformado por un total de 607 participantes (69.7 % mujeres) con una edad promedio de 21.28 (DE = 4.21) años, con el cual se realizaron los análisis factoriales confirmatorios. Los resultados dan cuenta de la adaptación lingüística, apreciándose un acuerdo inter-observadores adecuado (RVC > .70). El análisis factorial exploratorio sugiere una estructura de dos factores (χ2 = 646.750; gl = 36.00; p < .001) que explica el 41.2 % de la varianza; esta estructura fue corroborada mediante un análisis factorial confirmatorio que alcanzó índices de ajuste adecuados (CFI = .998; TLI = .996; RMSEA = .048). La fiabilidad de la escala se determinó por consistencia interna encontrándose coeficientes omegas que van entre .665 y .929. En suma, la ESPU es un instrumento con adecuadas evidencias de validez y fiabilidad para medir el sentido de pertenencia.
Palabras clave: sentido de pertenencia; estudiantes universitarios; análisis factorial confirmatorio; validez; educación
O sentimento de pertencimento refere-se à experiência de participação em um sistema ou ambiente de forma que cada membro se sinta parte integrante desse sistema. Este atributo é de interesse no âmbito educativo em distintos níveis, entretanto, não existem instrumentos que permitam sua mensuração nesse meio. O objetivo do estudo foi adaptar e analisar a estrutura interna da Escala de Sentido de Pertencimento em estudantes universitários peruanos (ESPU). Trabalhou-se com uma amostra de conveniência composta por 827 universitários, divididos em dois grupos, um de 220 estudantes (68,6 % mulheres) com média de idade de 21,68 anos (DP = 4,87), com o qual foi realizado uma análise fatorial exploratória. O segundo grupo foi composto por um total de 607 participantes (69,7 % mulheres), com média de idade de 21,28 anos (DP = 4,21), com o qual foram realizadas análises fatoriais confirmatórias. Os resultados mostram a adaptação linguística, apreciando-se uma adequada concordância interobservadores (RVC > 0,70). A análise fatorial exploratória sugere uma estrutura de dois fatores (χ2 = 646,750; gl = 36,00; p < 0,001) que explica 41,2 % da variância; esta estrutura foi corroborada pela análise fatorial confirmatória, que alcançou índices de ajuste adequados (CFI = 0,998; TLI = 0,996; RMSEA = 0,048). A confiabilidade da escala foi determinada pela consistência interna, sendo encontrados coeficientes ômega entre 0,665 e 0,929. Em suma, a ESPU é um instrumento com evidências adequadas de validade e confiabilidade para medir o sentimento de pertencimento.
Palavras-chave: sentimento de pertencimento; estudantes universitários; análise fatorial confirmatória; validade; educação.
The sense of belonging (SB) refers to the experience of participation in a system or environment in such a way that each member feels valued, included, and accepted, i.e., an integral part of that system (Pedler et al., 2022). It is an attribute that favors stability, interest, and future projection (Mellor et al., 2008). The SB is an attribute that can be developed in different areas of people’s lives, such as family, school, university, and workplace, among others (Hagerty et al., 1996). Likewise, SB predicts how meaningful people perceive their own lives (Lambert et al., 2013) and their involvement in the activities or groups in which they thrive (Haim-Litevsky et al., 2023). Recently, Slaton et al. (2023) found that the sense of belonging significantly drives the student-teacher relationship.
In the educational field, the Sense of Belonging at University (SBU) is defined as the affective, cognitive, and social perception concerning the university in which a person studies (Dávila de León & Jiménez, 2014). The SBU combines the development of feelings or sensations of connection experienced by the student when feeling accepted, respected, valued, and important to the group and the university (Strayhorn, 2018).
Ahn and Davis (2020) developed a structured classification; their analysis of students’ sense of belonging at university is multidimensional, defining four domains independent from each other: academic engagement, social, environment (geographical location, natural space, living spaces, and cultural aspects), and personal space (the area of self-identification, self-esteem, and life satisfaction). Belonging at university varies according to institutional and student characteristics, as shown by the studies of Gopalan and Brady (2020), who highlight that racial and ethnic minority and first-year (freshmen) students report a lower sense of belonging than their fourth-year peers. Also, the study conducted by Vaccaro and Newman (2017) analyzes the creation of a sense of belonging in first-year LGBTQ students. Furthermore, Walton and Cohen (2007) found that social belonging at university increases the academic performance of underrepresented ethnic groups.
Different research on the contributions of SBU suggests that students who have a greater sense of belonging tend to develop higher motivation and persistence (Strayhorn, 2012; Yeager et al., 2016), more academic self-confidence (Hausmann et al., 2007), higher levels of academic engagement (Davila & Jimenez, 2014; Gillen-O’Neel, 2021; Ostrove & Long, 2007), higher achievement (Aramendiz & Delgadillo, 2021; De Besa-Gutiérrez et al., 2019; Pedler et al., 2022; Strayhorn, 2018; Walton & Cohen, 2007) and allows identifying students involved in the activities proposed by the institution, being them who have a better relative assessment of the institution (Roque & Quizhpi, 2022).
Consequently, Patel et al. (2023) point out that the sense of belonging is essential for human motivation and can even influence how people develop professionally. According to Dávila de León and Jiménez (2014), SBU constitutes a predictor of general well-being. Thus, for example, in the case of graduates, the SBU stays with them. Moreover, it has been found that they maintain philanthropic attitudes towards their alma mater, also associated with commitment and participation in volunteer work (Drezner & Pizmony-Levy, 2021).
Likewise, Xu et al. (2023) report that university students with a high sense of belonging show a greater influence of professional identity and intrinsic motivation in improving their self-regulated learning capacity. However, Gravett and Ajjawi (2022) qualify these SBU approaches as traditional by considering it a universally positive, uniform experience and a fixed state of being. For this purpose, they contextualize the aftermath of the COVID-19 pandemic, in which the crisis highlighted the fluidity, limitations, and change of institutions, leading to a more nuanced conception of where and when students belong. Graham and Moir (2022) made another thoughtful contribution, when they expressed the need for authentic relevance; this stems from their concern about the prevalence of belonging pedagogy as an experience focused more on “fitting into the system” than focusing on a university under construction that emerges and exists through the interrelationships of those involved, i.e., how faculty and students constitute ecosystems and communities.
The above-mentioned issues highlight the relevance of the study of the sense of belonging at university since it evidently constitutes a predictor not only of academic performance but also of adjustment to university environment and, therefore, a protective factor against academic dropout (Ostrove & Long, 2007). However, the study of this construct has not been explored widely in Peru. This is due to the absence of a valid and reliable instrument to measure it. The literature review shows the scarcity of instruments that measure SBU, since most of them are applied to schoolchildren (Kuang et al., 2019; Slaten et al., 2018) and to other contexts specific to professional development (Patel et al., 2023; Rojas-Andrade et al., 2019).
Regarding the measures, the following was found: Hagerty et al. (1996) designed and validated the Sense of Belonging Instrument (SOBI) in three samples, one of university students, another of patients under treatment for major depression, and another of Catholic nuns. Initially, content-based validity was verified, which reached a Content Validity Index (CVI) equal to .83. To determine the structural validity of the measure an exploratory factor analysis (EFA) was used with the principal component analysis. Despite its usefulness, this is not a measure that allows the identification of belonging to an institution; rather, it explores the psychological state of the general sense of belonging and the desire or ability to develop this attribute.
In Latin America, this work found a scale to measure the sense of community in virtual social network groups (Novo et al., 2016) developed in Spain, whose structural validity was reported using a principal components EFA; a procedure currently discouraged (Lloret-Segura et al., 2014). In Chile, Rojas-Andrade et al. (2019) adapted the Sense of Community Scale (SCI-II) originally developed by Chavis et al. (2008) in a sample of high school students; the findings allowed corroborating the structure of three dimensions of the construct (connectedness, valued belonging, and membership-reciprocity); however, the sense of community is not equivalent to the sense of belonging.
Recently, other instruments have been proposed to measure the sense of belonging. Thus, Slaten et al. (2018) created the University Belonging Questionnaire on a sample of American undergraduates. The measure is comprised of 24 items distributed into three factors: university affiliation, university support and acceptance, and relationships with faculty and staff. However, the fit indices of the three-factor model were barely acceptable (CFI = .92; TLI = .93; RMSEA = .05), despite applying a strong maximum likelihood estimator.
Likewise, Checa and Oberts (2021) adapted Malone’s (2012) General Belongingness Scale (GBS) to a sample of Spanish adults between 17 and 73 years old, although the results demonstrate the structural solvency (ECV = 0.825; CR = 0.914) and the consistency of its scores (α = .917), this instrument does not measure the sense of university belonging and it instead focuses on analyzing the degree to which people have satisfied their need for belonging and have achieved a general sense of belonging. Furthermore, Pastor et al. (2022) adapted Leary et al.’s (2013) Need to Belong Scale (NBS) to Spanish on a sample of 540 adults. The results showed that the NBS achieved acceptable fit indices but the models tested showed problems in the factor loadings due to the presence of inversely worded items; such structure improved when excluding these items (CFI = .98; NNFI = .97; AIC = 59.27). It should be emphasized that this instrument does not measure the sense of university belonging; what it really measures is the need to belong as a form of motivation that drives the building of interpersonal relationships.
There are other instruments such as the Scale of Organizational Identification with Educational Centers and the Scale of Organizational Identification with Study Centers; the first was validated by Maluenda-Albornoz et al. (2022a) and the second, by Yáñez et al. (2006). Although both instruments measure identification, the first adopts a conceptualization of belonging as that of a person who is part of an organization; whereas, the second instrument measures the student’s identification with his or her degree program, not with the institution.
Thus, the instruments mentioned measure some specific aspect of identification with the professional activity, or with the organization from the perspective of a member of the institution’s staff. However, there is a need to learn about the sense of belonging as a psychological experience in terms of valued participation and person-environment adjustment of university students, and how it can promote well-being and even reduce the levels of academic desertion (Maluenda-Albornoz et al., 2023).
Additionally, Akar-Vural et al. (2013) designed the Sense of Belonging Scale, initially aimed at Turkish adolescents, which measures the sense of belonging to school. Its underlying theoretical model comprises two dimensions: the first called Contentment in School, which refers to the pride and happiness of being part of the institution, and the second Obedience of School Rules, which addresses compliance with the rules established by the institution. The results of the confirmatory factor analysis (CFA) corroborated this bifactorial structure, finding satisfactory fit indices (CFI = .98; NNFI = .97; RMSEA = .059).
The search for instruments to measure SBU led the research team to choose the Sense of Belonging Scale (Akar-Vural et al., 2013) as a measure that has theoretical support since the conceptualization of the construct takes into account its multidimensional nature and the psychological experience as such, given that it considers identification, security, and perceived emotional support (Dávila de León & Jiménez, 2014), all of which require time to develop; even age may lead to its consolidation (Hagerty et al., 1996).
The main purpose of the present study was to adapt and analyze the evidence of validity and reliability of the Sense of Belonging Scale in a sample of Peruvian undergraduates. Specifically, the scale was adapted to Spanish using the interobserver agreement procedure (back translation). Then, internal structure validity was explored. In addition, factorial invariance according to age was verified and, finally, the internal consistency of the scores was reported.
Method
Participants
This is an instrumental design study (Ato et al., 2013), in which 827 students from a private university in Peru participated, all chosen by convenience, due to their accessibility. For the purpose of the study, this sample was divided into two groups; exploratory analyses of the internal structure were performed on the first group. This sample comprised 220 students, 68.6 % women with an average age equal to 21.68 years (SD = 4.87). The second group included a total of 607 male (30.3 %) and female (69.7 %) participants with an average age of 21.28 years (SD = 4.21). A total of 49.1 % were 20 years old or younger and 50.9 % were 20 years old or older, from the study programs of psychology (30.70 %), administration (26.5 %), education (25.5 %), engineering (10.5 %), and communications (6.8 %) from a campus located in Metropolitan Lima. All correspond to socioeconomic level C (middle class) and have sociocultural characteristics in common.
Instruments
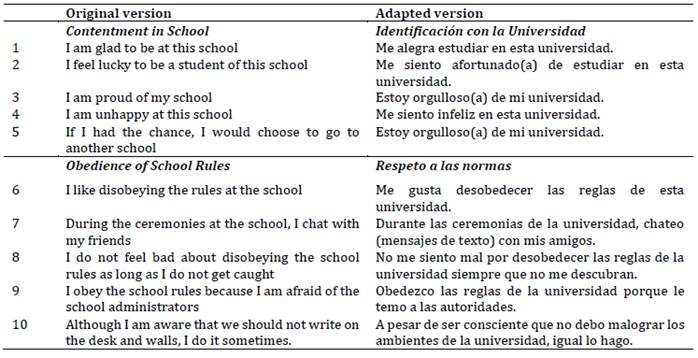
Sense of Belonging Scale (SBS; Akar-Vural et al., 2013). It is a self-reporting instrument with 10 items that measure the sense of belonging to the school in two dimensions: Contentment in School (items 1, 2, 3, 4 and 5), which refers to identification with the school, and Obedience of School Rules (items 6, 7, 8, 8, 9 and 10), which addresses disobedience of the institution’s rules. The SBS items present a Likert-type response scaling of five response options ranging from 1: strongly disagree to 5: strongly agree. The psychometric properties of the measure were analyzed using an EFA with the principal component method and varimax rotation; the assumptions of sample adequacy (KMO = 0.86) and item intercorrelation (χ 2 = 1,526.71; df = 45; p < .001) were verified. The two-factor structure explained 60.72 % of the variance and the factor loadings range from 0.68 to 0.86. Subsequently, through a CFA with the maximum likelihood method, the bifactor structure was corroborated. Factor 1: Contentment in School and Factor 2: Obedience of School Rules, which obtained adequate fit indices (χ 2 = .80.93; p< .001; CFI = .98; NNFI = .97; RMSEA = .059). Validity was also verified about other variables, identifying significant positive correlations with the scores of the Scale of Perceived Social Support and negative and significant correlations with the scores of the UCLA Loneliness Scale; as for reliability, alpha coefficients above .70 were reported, which corresponds to adequate values.
For this research, the items were adapted from English to Spanish; in addition, the discursive reality of the items was adapted to a university context; for this, the guidelines of the International Test Commission (ITC, 2017) were followed; the work had the advice of two translators with experience in these procedures who were entrusted with the process of translating the items (back translation).T1
Procedures
The data collection was carried out in the last semester of 2021 and the first months of 2022 on a sample of undergraduates. It was done remotely through a Google Form that was sent by different means: via personal and institutional e-mail. This form includes the informed consent where the objective of the study and the voluntary nature of the participation are explained, and the anonymity of the participants is guaranteed. To mitigate the risks of the remote application of the test, the recommendations of Elosua (2021) were followed: the information collected was secured, a backup copy of the data was generated, and instructions were provided so that participants filled out the forms in private. The research team ensured that the evaluation conditions facilitated the participants’ responses and the confidentiality and anonymity of the participants were guaranteed throughout the research process (American Educational Research Association et al., 2018).
Data Analysis
The statistical analysis was performed with the IBM SPSS pack 25, which was used to perform the descriptive analysis of the items and the EFA; and with RStudio version 1.1.456, specifically with the lavaan library (Rosseel, 2012) to perform the CFA. The statistical analysis was performed in phases. The absence of outliers and missing data was verified; the assumption of normality was checked using skewness (g1) and kurtosis (g2) coefficients: values ± 1.5 were taken as a range to estimate a normal distribution (Medrano & Muñoz-Navarro, 2017; Pérez & Medrano, 2010).
The Content Validity Ratio (CVR) proposed by Lawshe (1975) and later modified by Tristan (2008) was used to verify the interobserver agreement index. Its choice responded to the need for verification in a range of dichotomous variables (agreement/disagreement) by the observers regarding the equivalence of the translations made: values above 0.50 suggest acceptable agreement.
An EFA was performed to verify the sample adequacy and intercorrelation of the items, using the Weighted Least Squares (WLS) method with promax rotation. Then, a CFA was performed with the Weighted Least Square Mean and Variance Adjusted (WLSMV) method, due to the categorical nature of the data (Verdam et al., 2016), factor loadings of 0.40 were considered adequate (Williams et al., 2010). An adjustment to the χ 2 statistics was applied to attenuate the effect of non-normality (Satorra & Bentler, 1994; SB χ 2).
The fit indices reviewed were the chi-square ratio between degrees of freedom (χ 2/df) with expected values below 3, Root Mean Square Error of Approximation (RMSEA) and Standardized Root Mean Square Residual (SRMR) in both cases values below 0.08 suggested by Bentler and Bonnet (1980) were expected. The Comparative Fit Index (CFI) and Tucker-Lewis Index (TLI) were included with acceptable values above 0.95 (Hu & Bentler, 1999). From the factor loadings of both models, the Average Variance Extracted (AVE) was calculated, with satisfactory values of around 0.50; as a result, the evidence of convergent internal validity was verified (Fornell & Larcker, 1981). Additionally, the Composite Reliability (Composite Reliability Coefficient (RC)) was reported, with values above .70 being acceptable. Also, the configurational, metric, strong, and strict invariance was verified for which changes ΔCFI ≤.01, and ΔRMSEA ≤.015 were considered to establish invariance (Byrne, 2008; Putnick & Bornstein, 2016).
Finally, the internal consistency method was used to verify the reliability of the SBUS, and the omega coefficient was calculated based on the ordinal nature of the variables (Katz, 2006; Ventura-León, 2017).
Results
Translation and Linguistic Adaptation
To verify the relevance of the translation (English-Spanish), three translators with experience in this type of procedure were asked whether they agreed (1) or disagreed (0) with the quality of the translation. The agreement with the responses was verified using the CVR coefficient, with values ranging from 0.667 to 1.000 (see Table 2).
This procedure was replicated to evaluate the translation from Spanish to English (back translation) and the agreement indices showed similar behavior (CVR > 0.66). Additionally, three higher-education and educational psychology experts were asked to observe the adequacy of the language used for each adapted item. Additionally, it was decided to change the word “school” (escuela) to “university” (universidad), and 100 % agreement was reached on all items.
Table 2 shows the agreement indices for the translation from English to Spanish, the back translation and the linguistic adaptation of the SBUS. Furthermore, a sample of 20 students was surveyed on the comprehension of the questions and the correspondence with the answer alternatives; overall, the answers were favorable.
Table 2: Indices of Agreement for Linguistic Adaptation
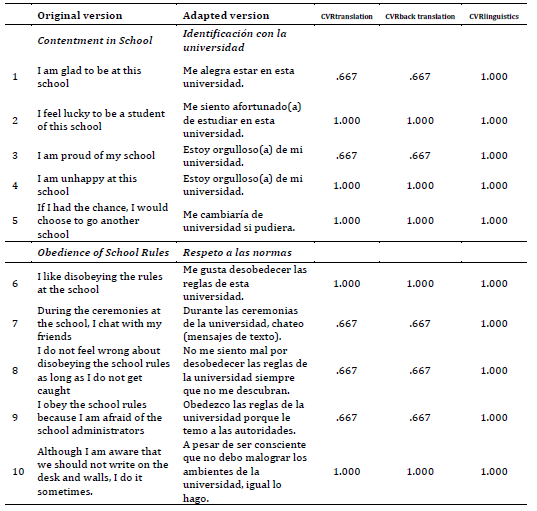
Notes: Index according to Lawshe (1975) and modified by Tristan (2008), appropriate values from 0.51 onwards.
Descriptive and Distributional Statistics
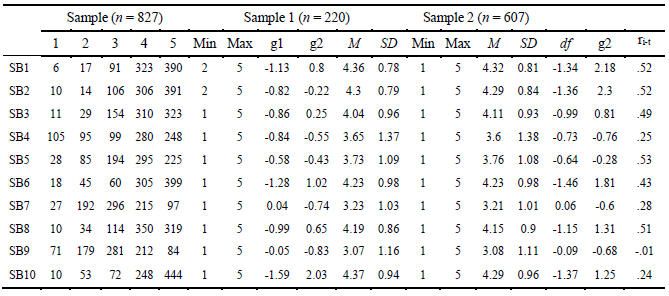
Table 3 shows the descriptive statistics of the SBS for both samples. For sample 1, the average ranges between 3.07 and 4.36 with a variability that fluctuates between 0.78 and 1.37. Regarding sample 2, the mean scores range between 3.081 and 4.316; the skewness coefficients suggest a negative skewness in most of the items; whereas the kurtosis coefficients denote that the largest proportion present a platykurtic distribution, except for items 4, 2, 7, and 9, which presents a leptokurtic distribution. Also, the frequencies of the response alternatives are reported, which is considered a statistic that allows the interpretation of a set of variables of ordinal nature. These values show a more accentuated distribution towards alternatives 4 and 5. The corrected item-test correlations were calculated for the sample of 607 participants, and these show that most of the items are above .20, except for item 9.
Evidence of Validity Based on Internal Structure
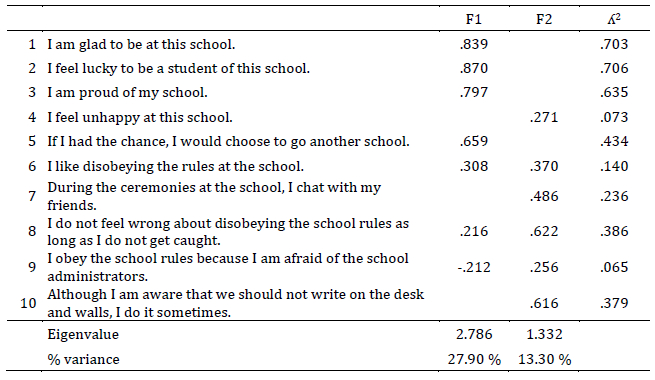
The EFA was conducted on a sample of 220 participants, the sample adequacy index was .789 which is acceptable; likewise, the intercorrelation of the items was adequate (χ 2 = 646.750; df = 36.00; p < .001). The factor loadings found in the first factor (27.9 %) range from 0.659 to 0.870, it was found that item 4 does not saturate adequately; as for the second factor (13.3 %), the loadings fluctuate between .256 and .622. This exploratory model explained 41.2 % of the variance (see Table 4).
Confirmatory Factor Analysis
Based on the information obtained in the EFA, four confirmatory models were analyzed (see Table 5). In two-dimensional Model 1, factor loadings above 0.40 were found, except for items 4 and 9, with partially adequate fit indices (SB χ 2/34 = 8.27; CFI > .95). In Model 2, items 4 and 9 are excluded, thereby increasing factor loadings, but fit indices do not improve substantially (SB χ 2/19 = 7.57; CFI > .95); additionally, the squared factor loading (ʎ2) has been included to expose a more accurate measure of the item’s association with its respective factor, it can be verified since items 4, 5, 9, and 10 present values below .40, indicating that the specific variance of these items is too high.
Table 5: Confirmatory Models of the SBUS
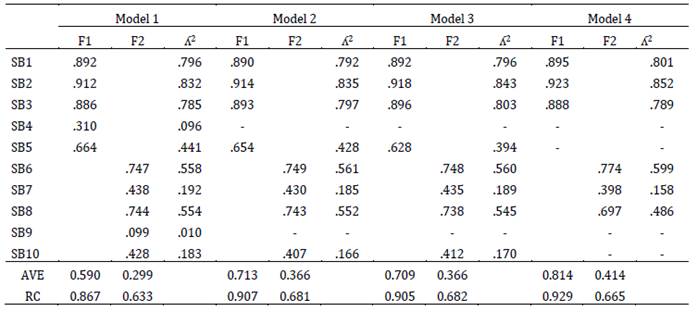
Notes: Model 1: original two-dimensional model; Model 2: two-dimensional model without items 4 and 9; Model 3: two-dimensional model without items 4, 9 and with a correlated error between items 5 and F2; Model 4: two-dimensional model without items 4, 5, 9 and 10.
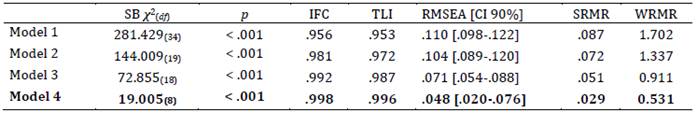
After reviewing the modification indices, we propose Model 3-two-dimensional model without items 4, 9 and with a correlated error between item 5 and the second factor-where the factor loadings improve and the fit indices are partially satisfactory (SB χ 2/18 = 4.04; CFI > .99). However, the correlation of item 5 with the second factor is theoretically inadequate. Thus, in Model 4 (two-dimensional model without items 4, 5, 9, and 10), the fit indices result is satisfactory (SB χ 2/8 = 2.37; CFI > .99).
Likewise, the Average Variance Extracted (AVE) was calculated to evaluate the convergent reliability of the factors identified, identifying that the AVE values of factor 2, which correspond to compliance with school rules, have values below what is expected (< .50); however, model 4 has the highest value of this coefficient. The same applies to the values of the Composite Reliability (CR) coefficient. In Model 1, for the first factor, it was equal to .867; for the second factor, a coefficient equal to .633 was found, which shows that the measure presents an adequate consistency in its scores. For the remaining models, this behavior was maintained, yielding higher measures for the first factor. Thus, in Model 4, the first factor reached a CR = 0.929 and for the second factor, it was 0.665.
Table 6 shows the fit indexes for the models analyzed. It can be observed that the comparative indexes suggest that Model 4 presents the most parsimonious and coherent structure, in comparison with Model 3, since it suggests the displacement of an item that theoretically was conceived for a different factor.
Factorial invariance by age and sex
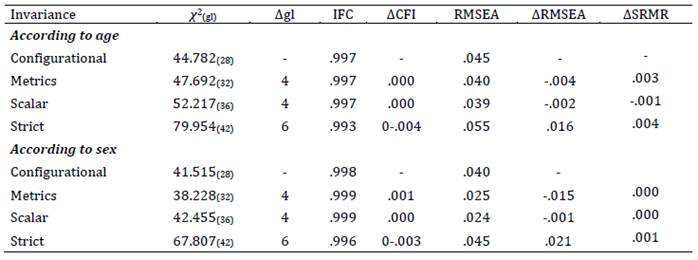
In Table 7, once Model 4 was identified as the best internal structure, the factorial invariance by age and sex was analyzed. In this regard, the results allow us to conclude that the SBUS presents configurational, metric, scalar, and strict invariance. When the configurational invariance is corroborated, this indicates that the same items or factors are present in all samples, although the specific values of the parameters may vary. Regarding metric invariance, the results show that the strength of the relationships between the items or factors and the construct is constant in both samples. Regarding scalar invariance, it refers to the equality of the variance of the measurement errors of the items or factors across all groups or conditions. As for strict invariance, the results indicate that the items or factors measure the same construct for all groups and that the loadings of the items or factors are equal in all groups. In sum, the invariance at these four levels suggests that the measurement instrument is valid and reliable for use in different groups or conditions since it consistently measures the same construct similarly for all of them.
Evidence of Reliability
The reliability of the SBUS was estimated for Models 1, 2 and, 4. For the first model, factor 1 reaches an omega coefficient equal to .809, while factor 2 reaches a coefficient equal to .576. In the second model, omega coefficients equal to .864 and .593 were reached for factors 1 and 2, respectively. In Model 4, the reliability values were .883 (first factor) and .571 (second factor). As shown, the reliability values of the first factor are adequate in all the models tested; however, the second factor barely reached measures above .50, which suggests that its scores are not consistent.
Discussion
The sense of belonging in undergraduates refers to the identification with the institution where they study, an important attribute for adequate academic performance (Hagerty et al., 1996). This study is relevant since it favors the potential of students (Aramendiz & Delgadillo, 2021; De Besa-Gutierrez et al., 2019; Hausmann et al., 2009), it is related to adaptation to university life (Ostrove & Long, 2007) and with general well-being (Dávila de León & Jiménez, 2014).
The purpose of this study was to linguistically adapt and analyze the internal structure of the Sense of Belonging Scale (Akar-Vural et al., 2013) on a sample of undergraduates. The results show that the translation procedure was carried out according to ITC’s guidelines (2017), and the linguistic adaptation carried out in which the word “escuela” (school) was replaced with “universidad” (university) did not alter the content of the measure; additionally, it positively affected the understanding of the items in the Peruvian university context. The procedure allowed for verifying the semantic adequacy of each item, and good agreement indices were obtained (Muñiz et al., 2013).
Concerning the structural validity of the SBUS, it was determined that, of the four models analyzed, Model 4 proved to be the most pertinent. For its analysis, the items that presented unstable behaviors were eliminated, among them item 4 (“I am unhappy at this school”), item 5 (“If I had the chance, I would choose to go another school”), item 9 (“I obey the school rules because I am afraid of the school administrators”) and item 10 (“Although I am aware that we should not write on the desk and walls, I do it sometimes”), improving the efficiency of the measure and resulting in a parsimonious, coherent, and interpretable structure (Fornell & Larcker, 1981).
The elimination of these four items may alter the theoretical content of the SBUS; however, this decision was made after considering that the wording of the items was confusing. This decision can be supported by documentation on the effect of negatively worded items, and current suggestions point to not including them in Likert-type measures (Suárez-Álvarez et al., 2018; Tomás et al., 2012). In addition, having three items per factor can be supported by authors such as Frías-Navarro (2022) and Costello and Osborne (2005), who point out that the inclusion of three items per factor constitutes a sufficient size for an adequate measurement of an attribute, even for the calculation of its reliability.
These differences found in the internal structure, as well as elimination of items from the original version developed by Akar-Vural et al. (2013) may be due mainly to cultural issues, specifically to the participants’ ability to understand texts, as reflected in the low factor loadings obtained by the negatively worded items. As could be seen reflected in items 4 (“I am unhappy at this school”) and 5 (“If I had the chance, I would choose to go another school”).
Another reason that may have implications on the results is the assessment that can be made on the compliance with school rules dimension of the sense of university belonging, because the reliability of this dimension is well below expectations. In general, Latin American countries have a negative expectation of their authorities, which leads them to question them constantly. The undergraduates surveyed may have this pattern ingrained which is evident from the inconsistent results obtained, which are reflected in an insufficient response effort (careless) (Johnson, 2005). This perspective on authorities is different in Europe, which may generate less bias or social desirability in their responses.
Based on the statistical analyses performed, a short version of the SBUS (Model 4) was obtained, preserving the underlying theoretical structure on which it was developed and obtaining even better fit indices than the original version (Akar-Vural et al., 2013). Thus, the first factor, called contentment in school, and the second, obedience of school rules, are maintained. This corroborates the multidimensional nature of the construct, which has been presented in other measures (Hagerty et al., 1996; Chavis et al., 2008; Rojas-Andrade et al., 2019; Slaten et al., 2018). However, it should be noted that although initially the SBUS can be used to measure the sense of belonging at university, this does not imply that it contains all the necessary components for a deep approach to the sense of belonging, because as described, belonging arises from a sense of connection with the institution (identification), feeling valued and respected, and also by feeling somehow accountable to the institution.
Likewise, it was possible to establish the factorial invariance of the measure according to age and sex (Model 4), which indicates that the SBUS does not introduce measurement biases for this attribute in Peruvian undergraduates (Byrne, 2008). By corroborating configurational, metric, scalar, and strict invariance we demonstrate that the internal structure is solvent, that the items measure the factor in which they are related to one another, and that the strength of the relationships between the items or factors and the construct is constant by both age and sex (Putnick & Bornstein, 2016). In sum, the invariance at these four levels suggests that the measurement instrument is valid and reliable for use across different groups or conditions, as it consistently measures the same construct similarly across them (Svetina et al., 2020).
Reliability was calculated using the omega coefficient since it is a more efficient measure for ordinal variables. The findings suggest that the SBUS scores are consistent for the first factor and present barely inadequate values for the second factor. These findings were relatively superior to those reported in the study by Akar-Vural et al. (2013). Notwithstanding, we need to consider interpretation of an additional coefficient-the composite reliability coefficient (RC), which is derived from the factor loadings-which obtains adequate values in all factors of the tested models. This discrepancy in the calculation of the coefficients could lead to further investigation in order to establish the reason for these discrepancies. If only the omega values are considered-which stand below .667 for the second factor of compliance with rules (Krippendorff, 2011)-this discrepancy may be due to problems in the understanding of the statements or insufficient response effort due to the nature of the construct.
The practical implications of this research are related to the contribution of a measure that will allow studying the sense of belonging in the university environment. Since it is a construct about adjustment to university life (Ostrove & Long, 2007), academic performance (Aramendiz & Delgadillo, 2021), strengthening of professional training (Corona, 2020), and identification of students involved with the activities proposed by the university, it helps them to develop a more favorable attitude towards the institution (Roque & Quizhpi, 2022) and guides people’s sense of life (Lambert et al., 2013). However, a deeper study of the instrument’s reliability is required to identify whether the low reliability values are due to a method issued associated with the wording of negative items which are predominant in the second factor. Additionally, this measurement needs to be taken cautiously bearing in mind that this is a first study and that further analysis is required to obtain a measure that has greater internal consistency.
In summary, we obtain a brief version of the SBUS comprised of six items distributed among two factors: contentment in school (“I am glad to be at this university”, “I feel lucky to be a student of this university”, “I am proud of my university”) and obedience of school rules (“I like disobeying the rules at this university”, “During ceremonies at the university, I chat with my friends”, “I do not feel wrong about disobeying the university rules as long as I do not get caught”). In this sense, the analysis of the item content and their dimensions is consistent with the conceptualization of the sense of belonging that has been presented in this study, since this is understood as the psychological experience in terms of valued participation and person-environment adjustment of undergraduates (Maluenda-Albornoz et al., 2022b; Maluenda-Albornoz et al., 2023).
Moreover, the SBU alludes to an affective, cognitive, and social perception concerning the university in which a person studies (Dávila de León & Jiménez, 2014). Therefore, the SBUS’ items combine feelings or sensations of connection, which are reflected in the first factor; while the second factor presents elements such as the experiences of acceptance that arise from the acceptance of the rules of coexistence, which manifest themselves when one feels accepted, respected, valued, and important in the group and university (Strayhorn, 2018). Nevertheless, the inclusion of negatively worded items that explore compliance with rules may have had a counterproductive effect seen in the results already discussed. Further study of the instrument and of aspects such as the conceptual equivalence and the revision of item content in subsequent studies is crucial.
The main limitation of the study lies in the non-probabilistic nature of the selected sample, which means that the results must only be considered in terms of its limited generalizability and can only be interpreted for similar sociocultural contexts. Another limitation of the study is that other forms of evidence validity-such as the relationship with other constructs-were not explored, rendering it essential to carry out future research to complement these findings.
REFERENCES
Ahn, M. Y., & Davis, H. H. (2020). Four domains of students’ sense of belonging to university. Studies in Higher Education, 45(3), 622-634. https://doi.org/10.1080/03075079.2018.1564902 [ Links ]
Akar-Vural, R., Yılmaz-Özelçi, S., Çengel, M., & Gömleksiz, M. (2013). The development of the “Sense of Belonging to School” Scale. Egitim Arastirmalari Eurasian. Journal of Educational Research, 53, 215-230. https://doi.org/10.14689/EJER.2013.53.12 [ Links ]
American Educational Research Association, American Psychological Association, & National Council on Measurement in Education. (2018). Standards for Educational and Psychological Testing. American Educational Research Association. [ Links ]
Aramendiz, M. F., & Delgadillo, N. (2021). Factores Asociados al Sentido de Pertenencia y su Relación con el Rendimiento Académico de los Estudiantes del Programa de Psicología de la Universidad Nacional Abierta y a Distancia-UNAD, CEAD Ibagué. (Tesis de Grado, Universidad Nacional Abierta y a Distancia). Repositorio Institucional UNAD. https://repository.unad.edu.co/handle/10596/40219 [ Links ]
Ato, M., López-García, J. J., & Benavente, A. (2013). Un sistema de clasificación de los diseños de investigación en psicología. Anales de Psicología, 29(3), 1038-1059. https://doi.org/10.6018/analesps.29.3.178511 [ Links ]
Bentler, P., & Bonett, D. (1980). Significance tests and goodness of fit in the analysis of covariance structures. Psychological Bulletin, 88(3), 588-606. https://doi.org/10.1037//0033-2909.88.3.588 [ Links ]
Byrne, B. (2008). Testing for multigroup equivalence of a measuring instrument: A walk through the process. Psicothema, 20(4), 872-882. [ Links ]
Chavis, D., Lee, K., & Acosta, J. (2008, junio). The Sense of Community (SCI) Revised: the reliability and validity of the SCI-II (Presentación de artículo). 2nd International Community Psychology Conference, Lisboa, Portugal. [ Links ]
Checa, I., & Oberst, U. (2022). Measuring belongingness: Validation and invariance of the general belongingness scale in Spanish adults. Current Psychology, 41(1), 8490-8498. https://doi.org/10.1007/s12144-020-01279-x [ Links ]
Corona, A. (2020). El sentido de pertenencia, una estrategia de mejora en el proceso formativo en las artes. Estudio de caso en Danza en una universidad mexicana. Páginas de Educación, 13(2), 59-79. https://doi.org/10.22235/pe.v13i2.2172 [ Links ]
Costello, A. B., & Osborne, J. (2005). Best practices in exploratory factor analysis: four recommendations for getting the most from your analysis. Practical Assessment Research & Evaluation, 10(7), 1-9. [ Links ]
Dávila de León, C., & Jiménez, G. (2014). Sentido de pertenencia y compromiso organizacional: predicción del bienestar. Revista de Psicología (PUCP), 32(2), 271-302. https://doi.org/10.18800/psico.201402.004 [ Links ]
De Besa-Gutiérrez, M. R., Gil-Flores, J., & García-González, A. J. (2019). Variables psicosociales y rendimiento académico asociados al optimismo en estudiantes universitarios españoles de nuevo ingreso. Acta Colombiana de Psicología, 22(1), 152-163. https://doi.org/10.14718/ACP.2019.22.1.8 [ Links ]
Drezner, N. D., & Pizmony-Levy, O. (2021). I belong, therefore, I give? The impact of sense of belonging on graduate student alumni engagement. Nonprofit and Voluntary Sector Quarterly, 50(4), 753-777. https://doi.org/10.1177/0899764020977687 [ Links ]
Elosua, P. (2021). Aplicación remota de test: riesgos y recomendaciones. Papeles del Psicólogo, 42(1), 33-37. https://doi.org/10.23923/pap.psicol2021.2952 [ Links ]
Fornell, C., & Larcker, D. F. (1981). Evaluating structural equation models with unobservable variables and measurement error. Journal of Marketing Research, 18(1), 39-50. https://doi.org/10.2307/3151312 [ Links ]
Frías-Navarro, D. (2022). Apuntes de estimación de la fiabilidad de consistencia interna de los ítems de un instrumento de medida. Universidad de Valencia. https://www.uv.es/friasnav/AlfaCronbach.pdf [ Links ]
Gillen-O’Neel, C. (2021). Sense of belonging and student engagement: A daily study of first- and continuing-generation college students. Reserah in Higher Education, 62, 45-71. https://doi.org/10.1007/s11162-019-09570-y [ Links ]
Gopalan, M., & Brady, S. T. (2020). College students’ sense of belonging: A national perspective. Educational Researcher, 49(2), 134-137. https://doi.org/10.3102/0013189X19897622 [ Links ]
Graham, C. W. & Moir, Z. (2022). Belonging to the university or being in the world: From belonging to relational being. Journal of University Teaching & Learning Practice, 19(4), Article 04. https://ro.uow.edu.au/jutlp/vol19/iss4/04 [ Links ]
Gravett, K., & Ajjawi, R. (2022). Belonging as situated practice. Studies in Higher Education , 47(7), 1386-1396. https://doi.org/10.1080/03075079.2021.1894118 [ Links ]
Hagerty, B. M., Williams, R. A., Coyne, J. C., & Early, M. R. (1996). Sense of belonging and indicators of social and psychological functioning. Archives of Psychiatric Nursing, 10(4), 235-244. https://doi.org/10.1016/S0883-9417(96)80029-X [ Links ]
Haim-Litevsky, D., Komemi, R., & Lipskaya-Velikovsky, L. (2023). Sense of Belonging, Meaningful Daily Life Participation, and Well-Being: Integrated Investigation. International Journal of Environmental Research and Public Health, 20(5), 4121. https://doi.org/10.3390/ijerph20054121 [ Links ]
Hausmann, L. R. M., Schofield, J. W., & Woods, R. L. (2007). Sense of belonging as a predictor of intentions to persist among African American and White first-year college students. Research in Higher Education, 48(1), 803-839. https://doi.org/10.1007/s11162-007-9052-9 [ Links ]
Hausmann, L. R. M., Ye, F., Schofield, J. W., & Woods, R. (2009). Sense of belonging and persistence in White and African American first-year students. Research in Higher Education , 48(1), 649-669. https://doi.org/10.1007/s11162-009-9137-8 [ Links ]
Hu, L., & Bentler, P. (1999). Cutoff criteria for fit indexes in covariance structure analysis: Conventional criteria versus new alternatives. Structural Equation Modeling: A Multidisciplinary Journal, 6(1), 1-55. https://doi.org/10.1080/10705519909540118 [ Links ]
International Test Commission. (2017). The ITC Guidelines for Translating and Adapting Tests (2nd ed.). https://www.InTestCom.org [ Links ]
Johnson, J. A. (2005). Ascertaining the validity of individual protocols from Web-based personality inventories. Journal of Research in Personality, 39(1), 103-129. https://doi.org/10.1016/j.jrp.2004.09.009 [ Links ]
Katz, M. H. (2006). Multivariable analysis (2a ed.). Cambridge University Press. [ Links ]
Kuang, X., Mok, M. M. C., Chiu, M. M., & Zhu, J. (2019). Sense of school belonging: Psychometric properties and differences across gender, grades, and East Asian societies. PsyCh Journal, 8(4), 449-464. https://doi.org/10.1002/pchj.275 [ Links ]
Krippendorff, K. (2011). Computing Krippendorff’s Alpha-Reliability. Annenberg School for Communication Departmental Papers. https://www.asc.upenn.edu/sites/default/files/2021-03/Computing%20Krippendorff%27s%20Alpha-Reliability.pdf [ Links ]
Lambert, N. M., Stillman, T. F., Hicks, J. A., Kamble, S., Baumeister, R. F., & Fincham, F. D. (2013). To belong is to matter: sense of belonging enhances meaning in life. Personality and Social Psychology Bulletin, 39(11), 1418-1427. https://doi.org/10.1177/0146167213499186 [ Links ]
Lawshe, C. H. (1975). A quantitative approach to content validity. Personnel Psychology, 28, 563-575. https://doi.org/10.1111/j.1744-6570.1975.tb01393.x [ Links ]
Leary, M., Kelly, K., Cottrell, C., & Schreindorfer, L. (2013). Construct validity of the Need to Belong Scale: mapping the nomological network. Journal of Personality Assessment, 95(6), 610-624. https://doi.org/10.1080/00223891.2013.819511 [ Links ]
Lloret-Segura, S., Ferreres-Traver, A., Hernández-Baeza, A., & Tomás-Marco, I. (2014). El análisis factorial exploratorio de los ítems: una guía práctica, revisada y actualizada. Anales de Psicología , 30(3), 1151-1169. https://doi.org/10.6018/analesps.30.3.199361 [ Links ]
Malone, G., Pillow, D., & Osman, A. (2012). The General Belongingness Scale (GBS): Assessing achieved belongingness. Personality and Individual Differences, 52(3), 311-316. https://doi.org/10.1016/j.paid.2011.10.027 [ Links ]
Maluenda-Albornoz, J., Bernardo, A. B., Díaz-Mujica, A., & Chacano-Osses, D. (2022a). Adaptación y evaluación psicométrica de la escala de Identificación Organizacional con Centros Educativos en estudiantado de ingeniería chileno. Cuaderno De Pedagogía Universitaria, 19(37), 144-156. https://doi.org/10.29197/cpu.v19i37.455 [ Links ]
Maluenda-Albornoz, J., Bazignan, C., & Rojas, X. (2022b). Belonging to Engineering During the First Year in Online Education. 41st International Conference of the Chilean Computer Science Society (SCCC), 1-6. https://doi.org/10.1109/SCCC57464.2022.10000341 [ Links ]
Maluenda-Albornoz, J., Berríos-Riquelme, J., Infante-Villagrán, V., & Lobos-Peña, K. (2023). Perceived Social Support and Engagement in First-Year Students: The Mediating Role of Belonging during COVID-19. Sustainability, 15(1), 1-10 https://doi.org/10.3390/su15010597 [ Links ]
Mellor, D., Stokes, M., Firth, L., Hayashi, Y., & Cummins, R. (2008). Need for belonging, relationship satisfaction, loneliness, and life satisfaction. Personality and Individual Differences , 45(3), 213-218. https://doi.org/10.1016/j.paid.2008.03.020 [ Links ]
Medrano, L. A., & Muñoz-Navarro, R. (2017). Aproximación conceptual y práctica a los modelos de ecuaciones estructurales. Revista Digital de Investigación en Docencia Universitaria, 11(1), 219-239. https://doi.org/10.19083/ridu.11.486 [ Links ]
Muñiz, J., Elosua, P., & Hambleton, R. (2013). Directrices para la traducción y adaptación de los tests: segunda edición. Psicothema , 25(2), 151-157. https://doi.org/10.7334/psicothema2013.24 [ Links ]
Novo, M., Redondo, L., Seijo, D., & Arce, R. (2016). Diseño y validación de una escala para la evaluación del sentido de comunidad en grupos académicos virtuales. Revista de Investigación en Educación, 14(2), 126-140. [ Links ]
Ostrove, J. M., & Long, S. (2007). Social Class and Belonging: Implications for College Adjustment. The Review of Higher Education, 30(4), 363-389. https://doi.org/10.1353/rhe.2007.0028 [ Links ]
Pastor, Y., García-Jiménez, A., Pérez-Torres, V., López de Ayala, M., & Catalina-García, B. (2022). The Need to Belong Scale Revisited: Spanish validation, wording effect in its measurement, and its relationship with social networks use in adolescence. TMP - Testing, Psychometric, Methodology in Applied Psychology, 29(2), 241-255. https://doi.org/10.4473/TPM29.2.6 [ Links ]
Patel, S., Shrisman, M., & Bennett, K. (2023). Development and psychometric testing of the Sense of Belonging in Nursing School (SBNS) Scale. Journal of Nursing Measurament, 31(1), 19-29. https://doi.org/10.1891/JNM-2021-0005 [ Links ]
Pedler, M. L., Willis, R., & Nieuwoudt, J. E. (2022). A sense of belonging at university: student retention, motivation and enjoyment. Journal of Further and Higher Education, 46(3), 397-408. https://doi.org/10.1080/0309877X.2021.1955844 [ Links ]
Pérez, E., & Medrano, L. (2010). Análisis factorial exploratorio. Bases conceptuales y metodológicas. Revista Argentina de Ciencias del Comportamiento, 2(1), 58-66. [ Links ]
Putnick, D. L., & Bornstein, M. H. (2016). Measurement invariance conventions and reporting: The state of the art and future directions for psychological research. Developmental Review, 41, 71-90. https://doi.org/10.1016/j.dr.2016.06.004s [ Links ]
Rojas-Andrade, R. M., Cabello, P., Leiva, L., & Castillo, N. (2019). Psychometric adaptation of the sense of community index (SCI-II) in Chilean public schools. Acta Colombiana de Psicología , 22(1), 273-284. https://doi.org/10.14718/ACP.2019.22.1.13 [ Links ]
Roque, Y., & Quizhpi, L. R. (2022). Sentido de pertenencia en estudiantes universitarios ecuatorianos en tiempos de pandemia. Puriq, 4, e272. https://doi.org/10.37073/puriq.4.272 [ Links ]
Rosseel, Y. (2012). lavaan: An R Package for Structural Equation Modeling. Journal of Statistical Software, 48(2), 1-36. https://doi.org/10.18637/jss.v048.i02 [ Links ]
Satorra, A., & Bentler, P. M. (1994). Corrections to test statistics and standard errors in covariance structure analysis. En A. von Eye & C. C. Clogg (Eds.), Latent variables analysis: Applications for developmental research (pp. 399-419). Sage. [ Links ]
Suárez-Álvarez, J., Pedrosa, I., Lozano, L. M., García-Cueto, E., Cuesta, M., & Muñiz, J. (2018). El uso de ítems inversos en las escalas tipo Likert: una práctica cuestionable. Psicothema , 30(2),149-158. [ Links ]
Slaten, C. D., Elison, Z. M., Deemer, E. D., Hughes, H. A., & Shemwell, D. A. (2018). The development and validation of the university belonging questionnaire. The Journal of Experimental Education, 86(4), 633-651. https://doi.org/10.1080/00220973.2017.1339009 [ Links ]
Slaton, C. R., Lammers, W., & Park, A. (2023). How school belongingness in diverse students moderates student perceptions of teachers’ cultural humility in predicting student-teacher working alliance. Psychology in the Schools, 60, 2360-2372. https://doi.org/10.1002/pits.22862 [ Links ]
Strayhorn, T. L. (2012). College students’ sense of belonging: A key to educational success for all students. Routledge. [ Links ]
Strayhorn, T. L. (2018). College students’ sense of belonging: A key to educational success for all students (2nd ed.). Routledge. [ Links ]
Svetina, D., Rutkowski, L., & Rutkowski, D. (2020). Multiple-group invariance with categorical outcomes using updated guidelines: An illustration using Mplus and the lavaan/semTools packages. Structural Equation Modeling, 27(1), 111-130. https://doi.org/10.1080/10705511.2019.1602776 [ Links ]
Tomás, J. M., Sancho Requena, P., Oliver Germes, A., Galiana Llinares, L., & Meléndez Moral, J. C. (2012). Efectos de método asociados a ítems invertidos vs. ítems en negativo. Revista Mexicana de Psicología, 29(2), 105-115. [ Links ]
Tristan, A. (2008). Modificación al modelo de Lawshe para el dictamen de validez de contenido de un instrumento objetivo. Avances en Medición, 6(1), 37-48. [ Links ]
Vaccaro, A., & Newman, B. M. (2017). A sense of belonging through the eyes of first-year LGBPQ students. Journal of Student Affairs Research and Practice, 54(2), 137-149. https://doi.org/10.1080/19496591.2016.1211533 [ Links ]
Ventura-León, J. (2017). Intervalos de confianza para coeficiente Omega: Propuesta para el cálculo. Adicciones, 30(1), 77-78. https://doi.org/10.20882/adicciones.962 [ Links ]
Verdam, M. G., Oort, F. J., & Sprangers, M. A. (2016). Using structural equation modeling to detect response shifts and true change in discrete variables: an application to the items of the SF-36. Quality of Life Research, 25(6), 1361-1383. https://doi.org/10.1007/s11136-015-1195-0 [ Links ]
Walton, G. M., & Cohen, G. L. (2007). A question of belonging: Race, social fit, and achievement. Journal of Personality and Social Psychology, 92(1), 82-96. https://doi.org/10.1037/0022-3514.92.1.82 [ Links ]
Williams, B., Onsman, A., & Brown, T. (2010). Exploratory factor analysis: A five-step guide for novices.Journal of Emergency Primary Health Care, 8(3), 1-13. https://doi.org/10.33151/ajp.8.3.93 [ Links ]
Xu, L., Duan, P., Ma, L., & Dou, S. (2023). Professional identity and self-regulated learning: the mediating role of intrinsic motivation and the moderating role of sense of school belonging. SAGE open, 13(2). https://doi.org/10.1177/21582440231177034 [ Links ]
Yáñez, R., Pérez, M. V., & Ahumada, L. (2006). Adaptación y validación de una escala de identificación organizacional con centros de estudio. Paideia, 41(1), 65-76. [ Links ]
Yeager, D. S., Walton, G. M., Brady, S. T., Akcinar, E. N., Paunesku, D., Keane, L., Kamentz, D., Ritter, G., Duckworth, A. L., Urstein, R., Gomez, E. M., Markus, H. R., Cohen, G. L., & Dweck, C. S. (2016). Teaching a lay theory before college narrows achievement gaps at scale. Proceedings of the National Academy of Sciences, 113, E3341-E3348. https://doi.org/10.1073/pnas.1524360113 [ Links ]
How to cite: Correa-Rojas, J., Grimaldo, M., Valdivia Vizarreta, P., & Del Águila-Chávez, M. (2024). Adaptation and Analysis of the Internal Structure of the Sense of Belonging at University Scale (SBUS) in Peruvian Students. Ciencias Psicológicas, 18(1), e-3498. https://doi.org/10.22235/cp.v18i1.3498
Authors’ contribution (CRediT Taxonomy): 1. Conceptualization; 2. Data curation; 3. Formal Analysis; 4. Funding acquisition; 5. Investigation; 6. Methodology; 7. Project administration; 8. Resources; 9. Software; 10. Supervision; 11. Validation; 12. Visualization; 13. Writing: original draft; 14. Writing: review & editing. J. C.-R. has contributed in 1, 2, 4, 5, 6, 11, 12, 13; M. G. in 1, 3, 5, 7, 9, 10, 13; P. V. V. in 3, 5, 10, 13, 14; M. del A.-C. in 5, 8, 10, 13, 14.
Received: June 28, 2023; Accepted: May 23, 2024
 Este es un artículo publicado en acceso abierto bajo una licencia Creative Commons
