


 Inglés (pdf)
 Articulo en XML
 Referencias del artículo

 Permalink
1. Introduction
Under certain management conditions, soil P availability often becomes vertically stratified within the 0-15 or 0-20 cm depth, with decreasing availability with depth1)(2)(3)(4. Broadcast P fertilization with no incorporation contributes to this high P stratification5. It has been hypothesized that under such conditions sampling at shallower depths compared with the traditional sampling depths of 0-20 cm relates better to yield response to applied P6. Adetunji7 addressed this hypothesis for maize on tropical alfisols and found that the correlation between soil test P and maize P uptake was similar for sampling the 0-10 cm compared with the 0-20 cm depth.
The relative accuracy of different soil test methods for P availability varies with soil types and P management conditions8. Among the dilute strong acid extractants, the Bray I method9 has been widely adopted mostly for acid-neutral soils of both North and South America that are fertilized with soluble P sources10)(11. Phosphorus sink-based tests, such as anion-cation exchange resins, were predictors of response to P for a variety of soil conditions12 and for pastures fertilized with sparingly soluble P fertilizers13. Among the dilute weak acids, the citric acid method was initially proposed by Dyer14, and more recently studied in pot experiments15, leguminous pastures16, flooded rice systems17, and forest systems18. In these studies, the correlation of citric acid P with P uptake or relative yield compared well with other soil tests, such as Bray I. Crop response to rock phosphate can be similar to triple superphosphate under some conditions19)(20)(21. The preferred soil P test method can differ with the applied P source22)(23.
To assess the correlation between the soil test value and crop yield, regression models are usually adjusted with the pasture's relative yield (RY) with P applied compared to no P application, using the ordinary least squares method. In this method RY is dependent and random, and soil test method is assumed independent, fixed and error-free. However, the soil P test value is not fixed as it is not controlled by the researcher24. To cope with this joint bivariate distribution25, Dyson and Conyers26 proposed the Arcsine Logarithm Calibration Curve (ALCC) method to determine soil test critical levels for nitrogen (N), P, potassium (K) and sulphur (S), as well as yield response potential in several crops.
Optimizing the choice of soil sampling depth and the soil test method for P availability will allow a more reliable management of P fertilization of pastures for increased net returns to fertilizer P and agronomic efficiency, while reducing the potential for P loss to the environment. The objective of this study was to evaluate two soil sampling depths and three test methods by comparing the goodness of fit between extractable soil P and the annual yield response of two forage legumes. The hypotheses were: a) that soil P test from a lower sampling depth (0-7.5 cm) correlates better with pasture yield response than when sampling at 0-15 cm depth; and b) that the citric acid method correlates better than the Bray I and the resin methods under different soil types and P fertilizer sources.
2. Materials and methods
2.1 Site description and trial design
The study was a set of field trials conducted from 2008 to 2012 at 14 sites in different regions of Uruguay to evaluate the response of Lotus corniculatus (LC) and Trifolium repens (TR) pastures to applied P (Table 1). (Table 1, in Supplementary material)
Table 1: Percentage of sand, silt and clay, soil pH in water, and soil P test using Bray I, citric acid and cationic resins as extraction methods (PBray, PCitric and PResins) for the experimental sites at the beginning of this study
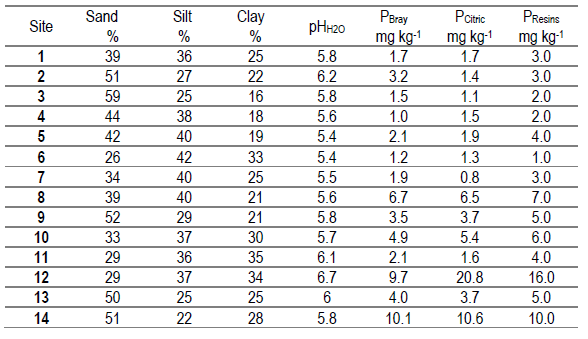
Pastures were established in 2008 by broadcast sowing after a chemical control of the native grassland. Due to a poor plant stand, the pastures had to be reestablished in the second year. The soil textures ranged from clay to sandy loam, and the soil pH ranged from 5.4 to 6.7. Sites with no history of fertilization and low levels of extractable soil P with natural grassland as their previous pasture were selected. Sites 12 and 14, however, did have some previous P inputs, with Bray I P of about 10 mg kg-1 compared with 1.0 to 6.7 mg kg-1 for other sites. Site 12 possibly received P via excreta due to temporal cattle concentration. Site 14 possibly had a history of fertilization associated with previous annual crop-pasture rotation.
The trials had a randomized complete block design with four replications. Plot size was 10 m2 (2*5m). Broadcast application of triple superphosphate (SP, 0-46-0) and Algerian rock phosphate (RP, 0-29-0) were compared at different annual rates (Table 2). The RP was ground to a mesh of 100 mm and 10% P rendered soluble in a 2% citric acid solution.

2.2 Data collection and analysis
In March-April of each year, soil samples were collected from each plot (20 cores per composite sample) for the 0-7.5 cm and 7.5-15.0 cm depths, and analyzed for P availability by Bray I9, cationic resins27 and citric acid14(Table 3). Soil P content at 0-15 cm depth was calculated as the mean extractable P of the two sampling depths.
Table 3: Main methodological aspects of the three soil phosphorus tests used in the present study: Bray I, Cationic resins and Citric acid

Note: techniques were slightly modified from the original studies in all cases.
Annual forage production was calculated for years 2 and 3 from seasonal yield determinations using a mower to a height of 5 cm. Dry matter yield was obtained from oven-drying subsamples at 105 °C and then corrected by percent cover of either LC or TR. Year 4 was also determined for sites 4 and 7. Considering the plot with the highest yield in each block for each source as 100%, the annual relative yield (RY) of each plot was calculated for each year as RY= measured plot yield/maximum yield at each block.
The first step of the statistical analysis was to study the relationship between soil test value (STV) and RY for each year by fitting models of linear regression with the arcsine-logarithm calibration curve (ALCC) method, as modified by Correndo and others28. A Microsoft Excel® spreadsheet was used as a model adjustment tool, designed for this purpose with the name "Modified ALCC Tool”29. Response curves were adjusted for subsets partitioned by site, species, depth, method, source, and year, which resulted in 696 regression curves. A total of 497 curves were selected as statistically significant (p<0.05) (Table 4), as suggested by Correndo and others.28
Through the model of Correndo and others28 the following statistics of adjustment are obtained: coefficient of determination (r2), root-mean-square error of the relative yield (RMSE RY) and of the soil test value (RMSE STV).
In the second step, a mixed model was applied, with site and species as random effects, while depth, method, source and their interactions were considered as fixed effects.
The assumption of normality was previously validated by the Q-Q plot (r2=0.998) and the Shapiro-Wilks test (p=0.378) based on the analysis of the model's residuals, confirming the normal distribution of the errors. The Levene test (p=0,067) confirmed that the variances were homogeneous. For the root-mean-square error of the relative yield (RMSE RY) and of the soil test value (RMSE STV), a non-parametric analysis of variance (Kruskal-Wallis) was performed. Statistical analyses were performed with the InfoStat software30.

3. Results
The annual forage yields ranged from 0 to 12838 with a mean of 4306 kg DM ha-1 LC, and from 0 to 13590 with a mean of 3866 kg DM ha-1 TR. The coefficients of determination (r2) recorded in the present study ranged from 0.25 to 0.86. Previous studies based on the ALCC method (Dyson and Conyers, 2013) reported that most coefficients of determination ranged between 0.06 and 0.49, although these authors did not filter for significant response curves.
The mixed model analysis was performed using compound symmetry, first-order autoregressive and autoregressive integrated moving average (ARIMA) error correlation structures. The ARIMA model was the most efficient of the three models, presenting the lowest AIC and BIC values and the highest loglik. Results obtained using the latter error correlation structure are presented in Table 5.
Table 5: Marginal hypothesis tests (SC type III) for the coefficient of determination (r2) obtained from calibration curves between soil P test and dry matter yield

3.1. Effect of soil sampling depth on goodness of fit between extractable P and forage yield response
Sampling depth and its interactions did not affect the r2 of the calibration curves between soil test P availability and forage yield (Table 5).
The RMSE STV was less with 0-15 cm compared with 0-7.5 cm soil samples (Table 6), but RMSE RY was not affected by sample depth.
Table 6: Coefficient of determination (r2), root-mean-square error of the soil test value (RMSE STV) and root-mean-square error of the relative yield (RMSE RY) from calibration curves between soil P test and dry matter yield, for the two soil sampling depths

Note: analysis of variance for r2; Kruskal-Wallis analysis for RMSE STV and RMSE RY. Means with a common letter for the same column were not significantly different (p>0.05).
3.2 Effect of soil test method and P source on goodness of fit between extractable P and forage yield response
The coefficient of determination was affected by soil test method and its interaction with P source but not with sampling depth (Table 5). For SP fertilizations, the citric acid and Bray I methods did not differ for the r2 and RMSE STV, while the cationic resins method had the lowest r2 and highest RMSE STV (Table 7). Citric acid has a slightly higher RMSE RY than cationic resins and Bray I.
Table 7: Coefficient of determination (r2), root mean square error of the soil test value (RMSE STV), and root-mean-square error of the relative yield (RMSE RY) from calibration curves between soil P and dry matter yield, as affected by soil P test method and P source

*Means with a common letter for the same source and in the same column were not significantly different (p>0.05). Note: SP: superphosphate; RP: rock phosphate.
When RP was used, citric acid and cationic resins showed higher r2 values than Bray I. Bray I had the lowest and cationic resins had the highest RMSE STV. RMSE RY was highest for Bray I and lowest for citric acid.
3.3. Correlation between the different soil P test
The correlations between the different soil P test methods for RP were lower than those for SP (Table 8). For both RP and SP, the correlation between cationic resins and citric acid was higher than the correlations of Bray I with the cationic resins and citric acid methods.

4. Discussion
In some studies, r2 values for STV with RY were higher for 0-10 cm compared with 0-20 cm soil sampling31. In the present study, however, there was a similar correlation between the pasture RY and extractable soil P for the 0-7.5 cm and 0-15 cm sampling depths, which is in agreement with other results for different crops32)(33)(34)(35)(36)(37. Soil test depth might have more effect with greater vertical stratification of available P36. Although plants may respond to stratification by adapting their root mass growth according to the vertical distribution of available P38)(39)(40, both LC and TR typically show root growth throughout the 0-15 cm depth in absence of physical or chemical barriers41)(42.
Del Pino and Ruiz32 reported that the coefficient of variation for the STV was higher for the 0-7,5 cm sampling depth than for 0-15 cm, and concluded that the shallow sampling depth was subject of a greater sampling error. The first centimeters of soil are exposed to a greater variation in moisture and temperature throughout the year, which directly relates with variability due to mineralization and immobilization processes43. The present study was not intended for measuring the sampling error. However, the higher values of RMSE STV found for the 0-7.5 cm would be consistent with a greater sampling error (Table 6).
The differences between the analytical methods are related to the nature of the extracting agent in each case and to the respective physicochemical mechanisms to remove or "solubilize” P from the soil matrix44)(45. The possible mechanisms are the following: the action of acid solvents, the substitution of the phosphate anion by other anions, the formation of compounds with polyvalent cations bound to P (Ca-P, Al-P, and Fe-P), and the hydrolysis of those cations bound to P44.
When P is added from soluble sources such as triple superphosphate, Bray I has a stronger lineal association with citric acid than with cationic resins, which is reflected in the correlations shown in Table 8 (r=0.84 and 0.75, respectively). In addition to P-bound cations, cations in the soil’s exchange complex can also be exchanged with the resins’ hydrogen ions, providing, in turn, additional P solubilization capacity. Therefore, cationic resins may have a stronger extraction of soil P on certain soils, as reported also by Casanova and others46. However, a significant amount of the resin-extractable P would not be actually plant-available, which is reflected in both a lower determination coefficient and a higher RMSE RY for cationic resins in Table 7.
When P is added from sparingly soluble sources such as phosphate rock, Bray I shows a low capacity to extract P bound to Ca from that source47. In this method, P extraction takes place by the effect of fluoride, which forms compounds with iron (Fe) and aluminium (Al), leaving P in soluble form. Additionally, the acidity dissolves a reactive fraction of calcium phosphates. However, this does not prevent from P being adsorbed to calcium carbonate or hydrated oxides of Fe or Al during the extraction procedure. In addition, calcium carbonate in soil may partly neutralize the extractant´s acidity, thus reducing its capacity for solubilizing phosphate46. In calcareous soils or in RP- fertilized soils, solubilized Ca may react with P to form insoluble compounds, removing P from the solution44. This low P extractability of Bray I when RP is used results in very low values of RMSE STV (Table 7). However, legumes have the capacity to solubilize complex P compounds by releasing organic acids (malate, citrates and oxalates) from their roots, which makes them highly efficient when rock phosphate is used as a source of P48)(49. This results in a poor correlation between Bray I and plant response and is demonstrated with a low r2 in Table 7.
In the citric acid method (as well as in other methods based on weak acids) P is rendered extractable through the formation of compounds with polyvalent cations, in this case with the citrate anion44. In addition, the citrate acts by anionic substitution, releasing the adsorbed P and preventing P reabsorption. This makes the citric acid method suitable for soils containing a significant amount of Ca-P, as it occurs with RP fertilization. This would explain the better adjustment of citric acid versus Bray I when RP is used as the source of P.
In the cationic resins method, the mechanism for solubilizing P operates by fixing cations (Fe, Al, Ca) to the cationic resins, with a similar result to that of compound formation. Additionally, as it is an exchange process, hydrogen ions (H+) are released, acidifying the medium, and adding the solvent action of acidity on a reactive fraction of calcium phosphates27)(50. Cationic resins and citric acid seem to have similar capacity to extract P-Ca, therefore evidencing a high correlation between them (Table 8) and slight differences in their relation with plant response (Table 7).
5. Conclusions
For the case of unmixed soils with broadcast application of P, shallow sampling (0-7.5 cm) did not evidence a better adjustment between relative pasture yield and soil P test values than deeper sampling (0-15 cm), with the latter showing less variation in soil P test values. Therefore, the recommended soil sampling depth for no-till pastures with broadcast fertilization should not be different from the traditional 0-15 cm depth.
The citric acid method generally evidenced a good performance for all soils and both P sources. It can be inferred that the citric acid method extracts a proportion of available soil P that is well correlated with the amount of P absorbed by the plants to produce forage.
For the ranges of soil’s physicochemical properties analyzed, this study provides evidences for soil P testing procedures to better assess plant available P for leguminous pastures. However, critical levels should be developed for an adequate interpretation of soil P test values according to pasture and soil types. This would allow for improved P fertilization recommendations in pastures.


