1. Introduction
Wheat (Triticum aestivum L.) farm yield potential is increasing at a relative rate of 1.0 % per year1; an insufficient increase to feed a population that annually grows at the same rate2. One solution to meet this demand for food is to expand the agricultural frontier, but the inclusion of soils with growth constraints can lead to higher risks of drought stress. Other risks for food security are the effects of ‘climate change’ adjudicated mainly to global warming3. From the 1970s in the tropics and subtropics, periods of drought have been more frequent, intense and in broader geographical extents4. Particularly, in South America when La Niña (the cold phase of the ENSO climate phenomenon) event occurs, the risk of drought stress increases in a greater wheat crop area during grain filling.
Water deficit during grain filling affects the kernel weight5)(6)(7)(8 and the grain industrial quality, largely due to that nitrogen and carbohydrates deposition rates are affected differently9. Severe stressors during this period or just before anthesis, may also affect the number of fertile tillers and the number of kernels10. These yield components are affected differently by water deficit, depending on the relationship between the plant water consumption and the initial level of available water, the time in which the stress event is initiated, and according to the duration of that stress period.
Severe stress events affect the rate of grain filling and the length of the grain-filling period11; however, mild stress events may lead to increase the rate of grain filling due to a greater sink activity, which would enhance the remobilization of carbon reserves from vegetative tissues to the kernels12. ‘Mild water stress’ refers to the level of water deficit to which the plant metabolism can be recovered after a certain period of stress. One way to identify mild water stress is the approach of Flexas and others13, who sustained that the level of photosynthetic activity can be recovered one day after re-watering if the previous values of g s were above 150 mmol H2O m-2 s-1.
There is agreement in the literature that kernel size in small cereals, in the absence of water stress and other adversities (biotic and abiotic), is a yield component limited by the sink capacity of the kernel14)(15. Normally, under drought stress conditions the sink strength in anthers and ovaries is irreversibly reduced; although, there is germplasm that can maintain the number of kernels, but affecting the kernel size16. Similarly, when germplasm of high yield is grown in more restrictive environments not only the sink strength would be limiting, but also the source capacity17.
Cultivars of slightly early anthesis and delayed but rapid leaf senescence, promote a higher rate of grain filling but of shorter duration, a higher rate of grain water absorption, and a maximum grain water content18. Senescence is a process genetically controlled but also affected by the sink-source relationship and environmental stresses19. Hence, cultivars of delayed but rapid leaf dehydration under mild water stress could be also little affected in their kernel weight. Even though leaf senescence is more related to the green leaf area index (LAI), and wilting is more related to the interception of radiation per unit of LAI20, drought-induced wilting may execute prematurely the onset of senescence19.
The genetics of drought stress resistance is complex and related to other abiotic stresses as salinity and frost temperatures21)(22. Largely due to this reason, several physiological traits have been studied; among them, the evolution of relative water content (RWC) as an indicator of wilting and of the plant water status23)(24. The normal physiology of the plant begins to be affected when the RWC decreases below 80 %25. Even though RWC may underestimate the water content when is measured in plants of high osmotic adjustment, it is a useful indicator to carry out easy measurements of the plant water status24. Among other studies, RWC has been used as a physiological trait to study adaptive strategies of cultivars under stress factors affecting the yield formation10)(26.
As an indicator of stomatal adjustment, another trait for studying adaptive strategies of cultivars to drought stress is the stomatal conductance (g s). Even though the g s is largely influenced by environmental conditions, as radiation; air temperature; vapour pressure deficit (VPD); and leaf water potential27)(28)(29)(30, it has been proposed as an important trait because cultivars of scarce regulation of g s show lower values of water use efficiency (WUE)31. Cultivars of lower WUE have also been identified in durum wheat, where landraces of high dry matter accumulation but moderate final grain yield, did higher use of water which was related to canopies of high LAI and g s. While, modern cultivars with canopies of similar g s but of lower LAI, did a lower use of water in early stages, which led to they finally had higher WUE32. Similarly, mediated by stomatal adjustment, conservative transpiration rates in early stages of wheat may outweigh the negative effect of decreased photosynthesis under drought stress conditions33)(34.
Water deficit during grain filling would promote different evolutions of RWC and g s that would cause different cultivar responses. Wheat cultivars that could maintain high values of RWC mediated by stomatal adjustment, would not necessarily affect the allocation of assimilates to the kernel. The aim was to study if the evolution of RWC and g s of four spring wheat cultivars under two levels of irrigation applied after anthesis can be related to kernel weight and the ratio of kernels to aerial biomass. The resulting information could be useful to identify wheat cultivars that under terminal drought stress could maintain the kernel weight, as a determinant component of grain yield and industrial quality.
2. Materials and Methods
2.1 Plant material
Four spring bread wheat cultivars, Biointa 1001, LE2249, LE2331, and LE2333 were evaluated under two levels of irrigation. These cultivars, that have been cultivated in the southern cone of South America, were chosen because in a previous study they showed different resource allocation to reproductive structures. In that study, LE2333 had a high number of kernels per spike, but a low number of spikes per plant and a low kernel weight together with LE2249. While, the cultivar LE2331 had a high number of spikes per plant, and together with Biointa 1001 a high kernel weight35.
2.2 Experimental design
The experiment was located at the Experimental Station INIA La Estanzuela, Colonia, Uruguay (34º20’15” S; 57º41’29” W), in a greenhouse equipped with fan and pad evaporative cooling system. The experiment was arranged in a randomized complete block design with three replications. A two-factorial arrangement of four cultivars and two levels of irrigation were evaluated. The experimental unit consisted of 24 plants planted in six pots (four plants per pot) placed on a plastic tray of 0.60×0.40×0.10 m. The pots were PVC tubes of 0.16 m of inner diameter and 0.30 m of height. A metal grid of fine mesh was placed in the base of each tube to contain the substrate. The substrate used was a mixture (1:1:1) of a silty clay loam soil, sand, and organic substrate (BioFer Almácigos, Riverfilco S.A., Montevideo, Uruguay).
The experiment was sown (27 June) with eight seeds per pot and thinned to four seedlings per pot after implantation. The plants received 8 to 6 h of artificial illumination with sodium vapour lamps of high pressure (SON-T 400 W, Philips, Belgium).
Before the anthesis stage, the experiment was watered once or twice a week according to the average water consumption of the four cultivars; this is that each cultivar was irrigated with the same amount of water (Figure 1). When 50 % of plants by cultivar and block reached the anthesis stage, two levels of irrigation were applied: a treatment well-watered (Control) and other watered with 50 % of the Control (Stress). Both irrigation treatments were applied until the experimental units in the Control treatment reached maturity.
The initial amount of water to irrigate the Control treatment was defined according to the maximum water holding capacity of a sample of an oven-dried substrate (12.8 % of initial moisture content). The dried sample substrate was put in an extra pot and was slowly watered until saturation. After 24 h, once the substrate in the pot stopped draining, it was weighted to calculate its maximum water holding capacity (1 L per pot).
The water consumption of the Control treatment was estimated following the water consumption of two check trays that were sown with the four cultivars (one cultivar per pot and tray, respectively). The check trays were placed on each side of the experiment (blocks 1 and 3, respectively). The water consumption of the check trays was calculated by the difference between the pot weights at maximum water holding capacity, and the pot weights immediately before each irrigation treatment.
At tillering stage GS 2.236, each pot was fertilized with 0.5 mL of N-P-K (12-8-5, foliar fertilizer NPK micronutrients, Industria Sulfúrica S.A., San José, Uruguay) diluted in 0.42 L of water. At the end of stem elongation (GS 3.7 to 3.9), the same dose of fertilizer was repeated, but applied on the trays and diluted in 5 L per tray.
Thrips (Insecta: Thysanoptera) were controlled alternating five applications of two active ingredients, Malathion (1.2 mL a.i. L-1) and Acephate (1 g a.i. L-1). Acarus (Arachnida: Prostigmata) were controlled with one application of Clofentezine (0.18 mL a.i. L-1). For controlling powdery mildew (Blumeria graminis f.sp. tritici), 4 g L-1 of wettable sulphur (Beltrame & Co, Montevideo, Uruguay) was applied.
2.3 Measurements
The RWC = (Fresh weight - Dry weight) × 100 / (Turgid weight - Dry weight) was determined according to Barrs and Weatherley23 once a week from anthesis to physiological maturity. The g s (mmol H2O m-2 s-1) was measured with a steady-state diffusion porometer (SC-1, Decagon Devices, Inc., Pullman, WA) during the same period and frequency than the RWC. The measurements of both traits were always carried out in the morning and before irrigation.
The RWC was determined in sections (2 to 3 cm) of three leaf blades per experimental unit. The blades were sampled from leaves below the flag leaf (FL-1) of the main stem of three plants of different pots. The fresh, turgid and dry weights of the three blade sections were determined. The g s was measured in the middle of the adaxial side of the flag leaf (FL) of the main stem in three plants of different pots.
After harvest, sun-dried aerial biomass per plant (biomass per plant) (g), spikes per plant, kernels per spike, kernels per plant, single kernel weight (mg), grain yield per plant (g), the ratio of kernels to aerial biomass (kernels/biomass ratio) (g-1), harvest index (grain yield/aerial biomass), irrigation WUE on yield basis (IWUEYI (g L-1) = grain yield/irrigation water), IWUE on aerial biomass basis (IWUEBI (g L-1) = aerial biomass/irrigation water), and the kernel protein concentration (%) were determined. The average number of kernels per plant was determined by counting the kernels in each spike of all plants of each experimental unit (24 plants). The kernel weight was determined weighting all kernels of each experimental unit divided by the total number of kernels. The irrigation water, the denominator of the IWUEs, was not discriminated in transpired water and evaporated water. The kernel protein concentration (moisture 13.5 %) was determined by the Laboratory of grain quality of the Experimental Station INIA La Estanzuela, using a spectrophotometer Serie 6500 (FOSS NIRSystem Inc., Silver Spring, MD, USA) calibrated by the technique of Kjeldahl (approved method 46-12, AACC 2000).
2.4 Data analysis
For all traits, except for RWC and g s, the statistical model (M1) used was: Y ijk = µ + α i + γ j + (αγ) ij + β k + e ijk , where µ, α, γ, β, and e, are the mean, irrigation treatments, cultivars, blocks, and the errors, respectively. To identify if there were treatment and interaction effects, a significance level of P<0.05 was considered for all traits. To identify mean differences among cultivars, the Tukey’s test and the Tukey-Kramer test were performed for balanced and unbalanced data, respectively. Also, orthogonal contrast tests were performed to discriminate interactions between cultivars and irrigation treatments.
For the repeated measurements in time of RWC and g s, the statistical model (M2) used was: Y ijkn = µ + α i + γ j + (αγ) ij + β k + e(a) ijk + s(αγβ) ijk + τ n + (ατ) in + (γτ) jn + (αγτ) ijn + e(b) ijkn , where the first four terms are the same that were mentioned above (M1), s is the between-subjects random effect, τ is the effect of days of initiated irrigation treatments (DIIT), and e(a) and e(b) are the errors a and b, respectively. Additionally, in the statistical model for g s, the VPD was included as a covariate. The VPD was calculated with the empirical exponential model of Prenger and Ling37, employing hourly records of temperature and air relative humidity at the time that the g s measurements were performed (Figure 1).
For traits RWC and g s, the covariance structure with different models was analysed. For the estimation of means, considering the likelihood ratio test (LRT) and the Akaike and Bayesian information criteria (AIC and BIC, respectively), it was chosen the spatial power law (SP(POW)) model with the Kenward-Roger adjustment. This model is recommended for repeated measurements taken at unequal times, correlations that decline over time, unbalanced data and multiple random effects38. Also for both traits, the adjusted means of the repeated measurements that were carried out on the same day were paired and correlated (according to Pearson’s r coefficient). Finally, all the adjusted means of RWC and g s were correlated with those traits affected by Stress treatment.
Moreover, the repeated measurements in time of RWC were fitted iteratively by least squares to the exponential model: bo + A (1 - exp(-k DIIT))39. The model indicates how the RWC decreases during grain filling and how it accelerates towards the senescence. The first parameter of the model (bo) indicates the RWC at anthesis; the second (A), the linear rate of decrease of the RWC; and the third parameter (k) indicates the RWC exponential decrease. The greater the water stress, the larger are the parameters A and k, whereas greater is the influence of A respect to k in the RWC decrease. To identify differences between treatments, the parameters estimated by the fitted model were subjected to the t-test of Welch-Satterthwaite.
All data were analysed with the PROC MIXED statistical procedure of the software SAS® version 9.2 (SAS Institute, Cary, NC, United States)40. In turn, the data of RWC were fitted to the model of Orskov and McDonald39 using the software InfoStat® version 9.0 (InfoStat Group, FCA, National University of Cordoba, Argentina)41.
3. Results
The Control treatment was irrigated with a cumulative mean of 2 L per plant, whereas the Stress treatment was irrigated with 1.5 L per plant, from sowing to maturity date (Figure 1). The cultivars LE2331, Biointa 1001, LE2333 and LE2249, were irrigated with 1.79, 1.72, 1.70 and 1.66 L per plant, respectively, but only the means of LE2331 and LE2249 differed significantly (P<0.05) related to differences in anthesis time, length of the grain filling period, and to the different VPD values during that time (Figure 1). Interaction between cultivars and irrigation treatments was not identified (P=0.5674, data not shown); this, due to after anthesis all cultivars in the Stress treatment were always irrigated at 50 % of the Control.
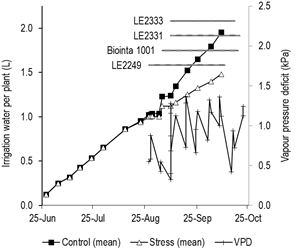
Figure 1: Cumulative mean irrigation water per plant supplied, from sowing to physiological maturity, to four spring wheat cultivars (Biointa 1001, LE2249, LE2331, and LE2333), showing two irrigation treatments (Control and Stress) applied from anthesis until the end of the grain filling period. The grain filling period for each cultivar is indicated by horizontal lines. Values of vapor pressure deficit (VPD) are shown for the grain filling period.
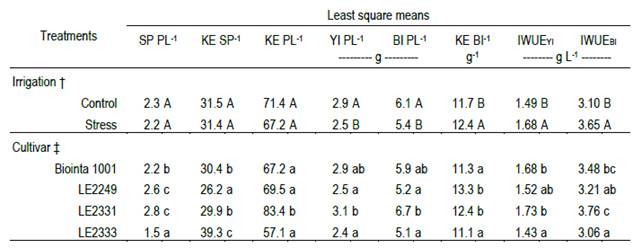
Table 1: Least square means of two irrigation treatments (Control and Stress) and four spring wheat cultivars (Biointa 1001, LE2249, LE2331, and LE2333). The traits observed are spikes per plant (SP PL-1); kernels per spike (KE SP-1); kernels per plant (KE PL-1); grain yield per plant (YI PL-1); dry matter of aerial biomass per plant (BI PL-1); the ratio of kernels to aerial biomass (KE BI-1); and irrigation water use efficiencies, on yield (IWUEYI) and aerial biomass (IWUEBI), respectively.
Spikes per plant, kernels per spike, and kernels per plant were not affected by Stress treatment (Table 1). Instead, for the three mentioned traits, statistically significant differences among cultivars were observed (P<0.001). The cultivars LE2249 and LE2331 had the highest mean values of spikes per plant (2.6 and 2.8, respectively), whereas LE2333 had the lowest value (1.5 spikes per plant) (P<0.05). The cultivar LE2333 also had the lowest number of kernels per plant (57.1), although it did not differ significantly from the values of Biointa 1001 and LE2249 (P<0.05).
On the contrary, grain yield per plant, biomass per plant, and the kernels/biomass ratio were significantly affected by Stress treatment, but while grain yield and biomass per plant were reduced, 14.8 and 10.9 % respectively, the kernels/biomass ratio was increased 5.9 % (P<0.05; Table 1). For the above traits, statistically significant differences among cultivars were also observed (P<0.01). The cultivar LE2331 had higher values of grain yield and biomass per plant, although they did not differ significantly from the values obtained by Biointa 1001 (P<0.05). Concerning to the kernels/biomass ratio, the cultivars LE2249 and LE2331 had higher values than Biointa 1001 and LE2333 (P<0.05). No significant interactions were identified for the three mentioned traits (data not shown).
No interactions were also identified for IWUEYI and IWUEBI (data not shown), but both traits had a significant increase due to the Stress treatment, 12.9 and 17.7 %, respectively (P<0.05; Table 1). Significant differences among cultivars (P<0.01) showed that LE2331 had higher values in both IWUEs, although they did not differ significantly from the values obtained by Biointa 1001, and by LE2249 in the case of IWUEYI (P<0.05).
A significant interaction between cultivars and irrigation treatments was observed for kernel weight (P=0.0125), harvest index (P=0.0014), and kernel protein concentration (P=0.0286) (Table 2). Only the cultivars LE2249 and LE2331 had a significant decrease in their kernel weight because of the Stress treatment, 10.4 % (P=0.0389) and 20.7 % (P=0.0002), respectively. With respect to the harvest index, only Biointa 1001 and LE2331 had a significant decrease, 4.0 % (P=0.0335) and 10.1 % (P<0.0001), respectively. On the other hand, except for LE2333 that had a decrease of 4.6 % (P=0.0520), the kernel protein concentration had a non-significant increase in the other three cultivars due to the Stress treatment.
At anthesis (DIIT 0), there were no significant differences in RWC and g s among cultivars and between both irrigation treatments (data not shown). The cultivar means of RWC ranged from 87.0 to 91.5 % (Figure 2), while the means of g s ranged from 136 to 207 mmol H2O m-2 s-1 in relation to the daily evolution of the VPD in the greenhouse (Figures 1 and 3). For this reason, the inclusion of the VPD as a covariate into the model had a significant effect (P=0.0024, data not shown) in the adjustment of the g s means.
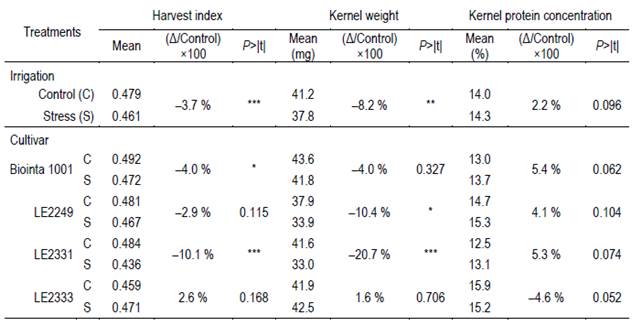
Table 2: Least square means and contrasts for harvest index, kernel weight and kernel protein concentration (moisture 13.5 %), of the interaction between two irrigation treatments (Control and Stress) and four spring wheat cultivars (Biointa 1001, LE2249, LE2331, and LE2333). The estimated differences between the irrigation treatments (Δ (Stress - Control)) are expressed as the percentage of decrease with respect to the Control ((Δ/Control) ×100).
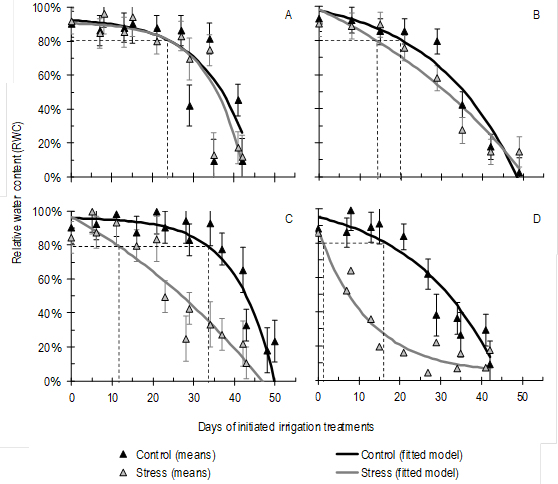
Figure 2: Repeated measurements in time of relative water content (RWC) determined in leaf blades below the flag leaf (FL-1) of four spring wheat cultivars, (A) LE2333, (B) Biointa 1001, (C) LE2249, and (D) LE2331, subjected to two irrigation treatments after the anthesis stage (Control and Stress). The diamonds indicate the means (n=3), where each n value was obtained by averaging three FL-1 samples; the vertical bars indicate the standard errors; the solid lines the fitted model of Orskov and McDonald39; and the dotted lines indicate the days after anthesis in that the RWC decreased below 80 % according to the applied irrigation treatments.
From anthesis to physiological maturity the values of RWC decreased because of the Stress treatment (P<0.0001), decrease that evolved in a significantly different manner for the four cultivars (P=0.0172) (Figure 2). In turn, the means of the repeated measurements in time of RWC showed a significant correlation (P<0.001) with the chosen exponential model (Figure 2; Table 3).
In Figure 2, the dotted lines indicate for each combination of cultivar and irrigation treatment, the DIIT on which the RWC decreased to 80 %, level at which the normal physiology of plant begins to be affected25. According to the fitted model, in the Control treatment RWC values below 80 % were observed after 22 DIIT, whereas in the Stress treatment, RWC values below 56.4 % were observed at the same time point.
In the Control treatment, the cultivar parameters of the fitted model (A and k) did not differ significantly according to the t-test of Welch-Satterthwaite (P<0.05; Table 3). Nonetheless, means differences of RWC among DIIT indicated that the dehydration and senescence began later in LE2333 and LE2249 than in the other two cultivars (data not shown). Also in the Control treatment, both cultivars were the only ones that maintained their RWC above 80 % beyond 20 days after anthesis (24 and 33 DIIT, respectively) (Figure 2A, 2C).
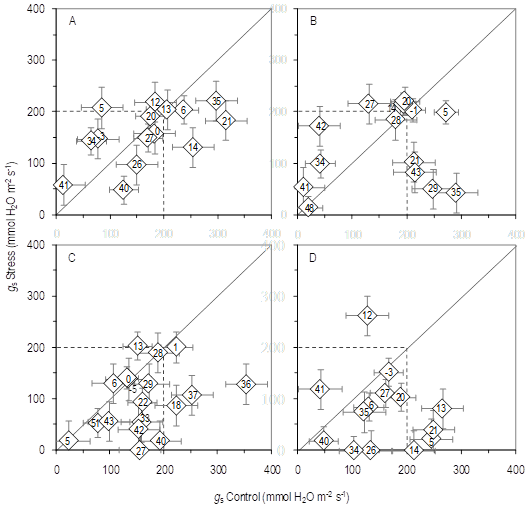
Figure 3: Relationship between repeated measurements in time during the grain filling of the adaxial stomatal conductance (g s) of flag leaf (FL) of four spring wheat cultivars: (A) LE2333, (B) Biointa 1001, (C) LE2249, and (D) LE2331, subjected to two irrigation treatments (Control and Stress). The numbers indicate the days after anthesis when the measurements were made, the diamonds indicate the means (n=3, obtained by averaging three FL per plot), and the vertical and horizontal bars indicate the standard errors for both axes.
In cultivars LE2333 and Biointa 1001, the RWC decreased at the same rate in both irrigation treatments (Figure 2A-B; Table 3). Conversely, in cultivars LE2249 and LE2331 a faster decrease of the RWC was caused by the Stress treatment, as can be observed by the significant differences in parameter k, and also by significant differences in parameter A in the case of LE2331 (P<0.05) (Figure 2C-D; Table 3). In turn, the rate of decrease in the Stress treatment was greater in LE2331 than in LE2249, as indicated by significant differences in both parameters k and A (P<0.05).
The values of g s also decreased because of the Stress treatment (P<0.0001), and in a significantly different manner for the four cultivars (P<0.0001), from anthesis to physiological maturity (Figure 3). Unlike with RWC, g s values were not fitted to a predictive model because of their daily oscillation. Even so, the contrast of data between both irrigation treatments indicated that cultivars LE2249 and LE2331 were the most affected by water deficit. This is shown in that most of the values of g s in the Stress treatment of both cultivars were below the 1:1 relationship lines. On the contrary, the cultivars LE2333 and Biointa 1001 showed a similar dispersion of values around the respective 1:1 relationship line.
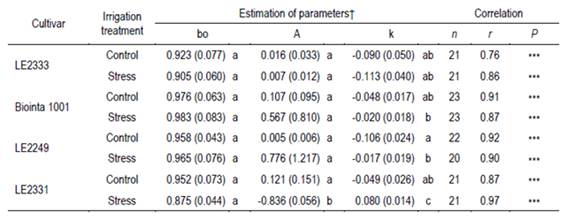
Table 3: Values and standard errors of the parameters fitted to the exponential model of Orskov and McDonald39 to estimate after anthesis the relative water content (RWC) = bo + A (1 - exp(-k DIIT)) in leaves of four spring wheat cultivars (Biointa 1001, LE2249, LE2331, and LE2333), where DIIT are the days of initiated two irrigation treatments (Control and Stress). The Pearson’s coefficient (r) indicates the correlation between the observed and the predicted values.
The correlation analysis for all treatment means indicated a significant positive correlation between the repeated measurements of RWC and g s (r=0.32; P=0.0227; n=50, data not shown). In turn, until 27 DIIT significant and positive correlations were also identified between the RWC measurements and kernel weight, whereas significant but negative correlations were identified for the kernels/biomass ratio (Table 4). Less clear correlations were identified through the time between the g s measurements and kernel weight, but they were significant and positive on days 5, 14 and 20 after initiated the irrigation treatments. Finally, between g s and the kernels/biomass ratio significant but negative correlations were also identified on the same days (Table 5).
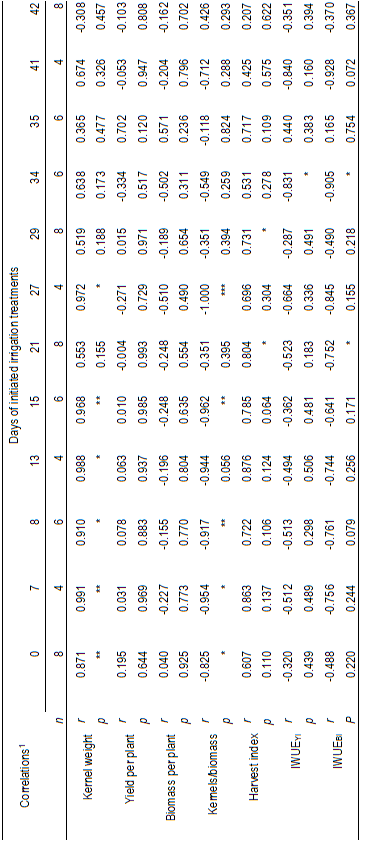
Table 4: Correlations between repeated measurements in time of relative water content (RWC) with kernel weight, yield per plant, biomass per plant, the ratio of kernels to aerial biomass (kernels/biomass), harvest index, and irrigation water use efficiencies, on yield (IWUEYI) and aerial biomass (IWUEBI). The data correspond to four spring wheat cultivars (Biointa 1001, LE2249, LE2331, and LE2333) subjected to two irrigation treatments (Control and Stress) after anthesis.
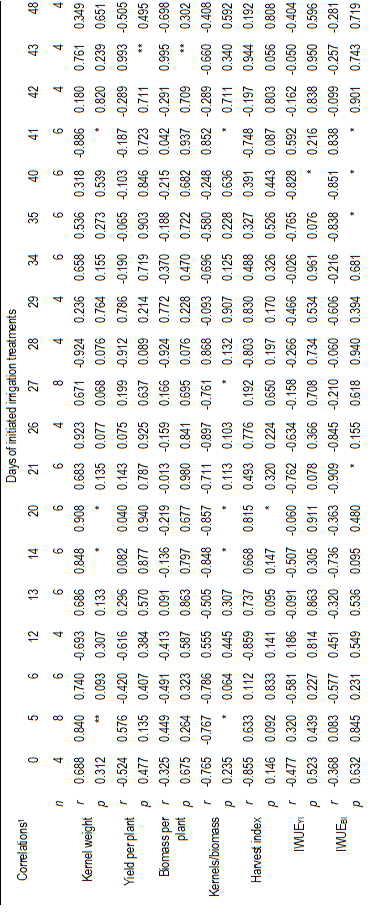
Table 5: Correlations between repeated measurements in time of stomatal conductance (gs) with kernel weight, yield per plant, biomass per plant, the ratio of kernels to aerial biomass (kernels/biomass), harvest index, and irrigation water use efficiencies, on yield (IWUEYI) and aerial biomass (IWUEBI). The data correspond to four spring wheat cultivars (Biointa 1001, LE2249, LE2331, and LE2333) subjected to two irrigation treatments (Control and Stress) after anthesis.
4. Discussion
In this work, the number of kernels per plant was not affected by the Stress treatment (Table 1), a yield component that can be affected by severe stresses and/or by stresses that begin before the anthesis stage5)(10. However, the progressive water stress applied after anthesis caused different cultivar responses for harvest index, kernel weight, and kernel protein concentration (Figure 1; Table 2). Those responses were related to cultivar differences in the formation of the grain yield and of the biomass allocation (Table 1), and to cultivar differences in the RWC and g s evolutions in response to both irrigation treatments (Figures 2 and 3).
In this regard, it is observed that cultivars with a greater number of spikes per plant and kernels/biomass ratio (LE2331 and LE2249), were the only ones that had a significant decrease of the kernel weight (Tables 1 and 2). According to Dreccer and others42, the decrease of the kernel weight in genotypes of high number of tillers could be related to a lower level of stem reserves of water-soluble carbohydrates. In addition, only the harvest index of cultivars LE2331 and Biointa 1001 decreased significantly due to the Stress treatment (10.1 and 4.0 %, respectively). So, it could be interpreted that the three mentioned cultivars were affected because of a co-limitation sink-source.
Positive correlations identified between RWC measurements and kernel weight indicate that Stress treatment caused leaf dehydration (Table 4), which ultimately affected the allocation of biomass into the kernels of cultivars LE2249 and mainly LE2331 (Figure 2C-D; Table 2). Final kernel size depends on the number of endosperm cells -defined for wheat around 15 to 20 days after anthesis-, and of the final endosperm cell size43)(44. Values of RWC below 80 % promote a general metabolic inhibition; this is, lower activity of the sucrose phosphate synthase and protein synthesis related to a lower transpiration efficiency25)(45; while, values below 70 % cause non-stomatal oxidative stress in the photosynthetic machinery25)(46. In that sense, in the Stress treatment the RWC of LE2249 decreased below 80 % after 11 DIIT, whereas for LE2331 the same occurred, but from the beginning of the period (Figure 2 C-D).
No significant correlations between kernel protein concentration and the measurements of RWC and g s were identified (data not shown). However, there was a tendency that as the kernel weight and harvest index decreased, the kernel protein concentration increased (Table 2). This would be related to the fact that the rate of nitrogen deposition in the kernel is reduced more slowly than the rate of carbohydrates deposition9.
Two types of contrasting responses in the evolution in time of RWC were identified: 1) LE2333 and Biointa 1001 that had a similar evolution of RWC in both irrigation treatments (Figure 2A-B), and 2) LE2249 and LE2331 that had an early decrease of RWC in the Stress treatment (Figure 2C-D).
In one response, the cultivars of lower allocation of biomass to the kernels, LE2333 and Biointa 1001, maintained the RWC for a longer period of time under the stress conditions (Table 1; Figure 2A-B). However, Biointa 1001 would have sensed the stress earlier because it did not decrease the kernel weight, but decreased the harvest index (Table 2). Conversely, the cultivar LE2333 was not affected in both mentioned traits. Cultivars as LE2333, of delayed but rapid leaf dehydration at the end of the cycle, would promote higher rates of grain filling but of shorter duration18.
In the other response, the cultivars of higher allocation of biomass to the kernels (LE2249 and LE2331) (Table 1), would have sensed the deficit at the beginning of the stress period as a mild stress. The rapid loss of water would have been caused by scarce control of the stomatal adjustment (Figures 2C-D and 3C-D). Mild stresses during grain filling would affect the kernel weight, but not other yield components because the effects would be delayed beyond the cell division phase7)(47. In that sense, a rapid decrease of the water status caused a decrease in the kernel weight of both cultivars. Thus, the applied progressive water stress during the grain filling would have promoted in these cultivars that kernel weight was finally limited not only by its sink capacity, but also by the source capacity of the plant12.
Despite the contrasting type of response in the evolution of RWC of Biointa 1001 and LE2331, both cultivars did not differ significantly in their grain yield per plant (Table 1; Figure 2B, 2D). A low control of the closure of stomata of Biointa 1001 caused that this cultivar had a rapid wilting of the basal leaves to maintain the RWC in the upper leaves (Figures 2B and 3B). However, a lower volume of green LAI would explain the decrease of the harvest index (Table 2) through a reduced interception of radiation per unit of LAI20, and probably due to a reduced sink size, since under drought stress conditions the sink strength in anthers and ovaries can be irreversibly reduced16.
Stomatal responses shown by the four cultivars are consistent with the two types of response identified in the RWC evolution (Figures 2 and 3). Cultivars that had a rapid decrease of the RWC in the Stress treatment (LE2249 and LE2331), had a greater stomatal adjustment, as can be observed by the g s values located below the 1:1 relationship lines (Figures 2C-D and 3C-D). The positive and significant correlation between all the repeated measurements of RWC and g s (r=0.32; P=0.0227; n=50, data not shown) was indicative that maintaining high values of g s is only possible if high water status is also maintained33.
During the grain-filling period, the g s of the cultivar LE2333 was scarcely affected by the Stress treatment, as was also the RWC evolution. A possible explanation for this is that the osmotic potential in the sink may not have declined below the optimum. So, an enhanced sucrose uptake and starch synthesis related to increased carbon remobilization from vegetative tissues may have occurred7)(12)(18)(42)(48. In relation to this, the grain yield per plant, biomass per plant, and kernels/biomass ratio of LE2333, did not differ significantly from the cultivar means of LE2249 (Table 1). However, the Stress treatment caused in LE2249 a significant decrease of the RWC, and consequently, a 10.4 % decrease in the kernel weight (Tables 1, 2 and 3; Figure 2).
Similar to WUE, the ratio between the CO2 assimilation rate and the transpiration rate49, the increase of the IWUEYI and IWUEBI caused by the Stress treatment means that per each unit of grain yield and aerial biomass, more efficient was the use of irrigation water made by the plants (Table 1; Figure 3). Cultivars of high WUE per se not necessarily should be associated with drought stress resistance. This, because they may have higher yield potential with moderate use of water, or may have moderate yield potential with reduced use of water50. In this regard, even though LE2331 and Biointa 1001 showed higher WUEs (Table 1), they would have used much more water if it had been provided. This was observed after each irrigation event when the available water in the trays decreased faster than the water in the trays of cultivars LE2249 and LE2333.
5. Conclusions
A progressive water stress applied after anthesis to four spring wheat cultivars had different effects in relation to the time the stress was sensed by the plants. Using an exponential model not reported previously for the adjustment of RWC measurements, two types of cultivar responses in the RWC evolution were identified and correlated with the g s evolution, the kernel/biomass ratio, and the kernel weight. In the most notorious response, at the beginning of the stress period, the cultivars LE2249 and LE2331 would have sensed the deficit as a mild water stress. This, because an early and rapid leaf wilting related to a concomitant stomatal adjustment, finally caused grain yield losses due to the decrease of the kernel weight. Cultivars with that type of response could be limited not only by the sink strength, but also by the plant source capacity during the grain-filling period.


