1. Introduction
Actual evapotranspiration (ET) is a key variable in water resources management since it could affect the soil water balances from farmer to catchment scale. ET is the sum of transpiration from plant canopy and evaporation from soil. It differs from the concept of reference evapotranspiration (ETo), which is the evaporation from a reference surface (hypothetical grass reference crop), not short of water; and also differs from the concept of crop evapotranspiration (ETc), which is the evapotranspiration of a given crop from disease-free, under optimum soil water conditions. From a practical point of view, the ET process affects mainly the crop yields, then the runoff characteristics; in both cases, decisions like irrigation strategies or water allocations are made with partial information of ET.
ET is usually measured by lysimeters, Eddy Covariance flux, sap flux or estimated by satellite remote sensing products; it can also be simulated by using empirical/physical relationships as soil water balances, energy balances, or the Penman-Monteith model. The advantages of using satellite ET estimations to provide information have been recognized; e.g. ET estimated by MODIS16 could help to identify structural errors of hydrological models1. Despite this, satellite ET is still not used as it could be. This may be for a number of reasons. On the one hand, satellite ET can be affected by significant errors which are difficult to quantify. On the other hand, issues related to scales need to be assessed and incorporated in the conceptualization of the hydrological system.
This technical paper examines similarities and discrepancies of ET derived by MODIS16A2 (ETmodis) in Uruguay with respect to three reference techniques: (1) INIA-GRAS Water Balance on a country-scale (ETgras); (2) Soil & Water Assessment Tool (SWAT) on the catchment-scale (ETswat); and Eddy Covariance Flux on a farmer-scale (ETedco).
2. Materials and methods
MODIS16A2 is the 6th version of an Evapotranspiration satellite product hosted by NASA Earth Observing System Data and Information System. This product provides an estimation of ET (ETmodis) as well as potential evapotranspiration (PET) with 500 meters/8-day spatio-temporal resolution. It is based on the Penman-Monteith model, using daily meteorological reanalysis and 8-day remote sensing data products2. Surface net radiation and soil heat flux are estimated by MODIS 8-day albedo and daily meteorological reanalysis. The net radiation is then distributed between soil and vegetation by the Fraction of Photosynthetically Active Radiation. Surface stomatal conductance, aerodynamic resistance and wet canopy are estimated by daily air temperature, vapour pressure deficit and relative humidity data. Additionally, MODIS land cover is used to specify the biome type. Data is freely available from 2001 to present with worldwide coverage2.
The experiment presented in this technical paper consists of comparing the ET derived by ETmodis against the ET estimated from three reference methods: (1) INIA-GRAS Water Balance (ETgras), (2) SWAT model (ETswat), and (3) the Eddy Covariance Flux (ETedco). The comparison is made in the temporal resolution of MODIS16A2 (8-day total ET). R-squared (R2), percentage bias (PBIAS), and root mean squared deviation (RMSD) are used (equations 1, 2 and 3).
Where ETbench is the ET obtained by the reference methods scaled to the temporal resolution of ETmodis (8-days), and n is the number of samples.
INIA-GRAS water balance model is an operational product of the GRAS Unit of the National Institute of Agriculture Research (INIA Uruguay) that estimates the water content for the soils of Uruguay. Additionally, it offers an estimation of potential evapotranspiration, actual evapotranspiration (ETgras), effective precipitation and runoff. The model for PET is based on the Penman-Monteith equation3. The water balance uses the conservation of mass and a logarithmic model for the daily water retention. The model runs throughout the country on a daily basis, gridded with 30×30 km spatial resolution (Figure 1). The model incorporates local soil information, agrometeorological data and kriged precipitation from a rich rain gauge network (84 rain gauges). The methodology considers that the vegetation cover is grassland, which intercepts 100% of the incident radiation and is actively growing4)(5)(6)(7. The study period is 2004-2018.
The Soil & Water Assessment Tool (SWAT) is a watershed model used to predict water availability and environmental impacts8. Spatial heterogeneities are grouped in Hydrological Response Units (HRU) and a mesh of sub-basins. Then, ETswat is estimated at HRU level by a soil water balance, where two methods for PET could be used: Penman-Monteith or Hargreaves. This study uses a previous implementation of the SWAT model in the Santa Lucía basin at Paso Pache (Figure 1)9)(10. It is based on the Penman-Monteith equation with 41 sub-basins and 865 HRU. The comparison was done on the sub-basin level, ranging from 20 to 300 km2 in 2010 to 2016.
Eddy Covariance Flux is a micrometeorological technique to estimate carbon, water and heat flux with high temporal resolution (less than an hour), and on spatial scales ranging from 100-2000 meters. The technique uses high frequency measurements of wind velocities, carbon dioxide and water vapour as well as low frequency measurements of other standard micrometeorological parameters (solar radiation, air temperature, relative humidity, etc.). The method calculates the covariance of fluctuations in the vertical wind velocity and in the physical quantity to be measured (i.e. water vapour), and derives an integrated estimate of flux over a short time period (typically half an hour or one hour)11. In this work, a 3×3 neighbouring grid of ETmodis (resolution 500×500 m) is compared against ETedco derived by an Eddy Covariance located in Colonia12)(13 (Figure 1, 3). The study period starts in February 2011 and finishes in May 2012, it contains 13 complete samples of 8-days of total ET.
3. Results
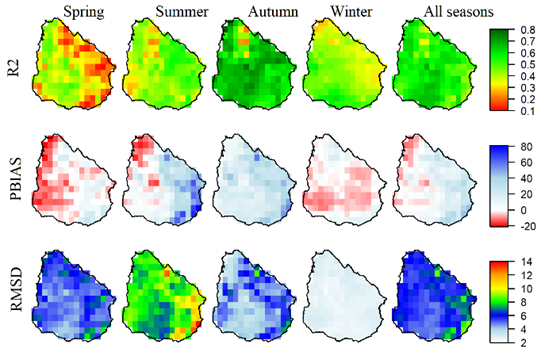
On the country-scale, Figure 2 shows the R2, PBIAS and RMSD of ETmodis vs ETgras. The spring shows the highest spatial variability of R2 being the best values in the western part of the country. Also, this season shows negative bias on the west and mid to low RMSD across the country. During the summer the R2 is improved, especially in the east. However, non-negligible positive PBIAS and high spatial variability of the RMSD appear. During the autumn-winter season ETmodis is quite similar to ETgras; they show high R2, low PBIAS and low RMSD. Additionally, in the winter, similarities are spatially homogeneous. The overall similarity of ET estimations across all the seasons shows R2 values above 0.5, positive/negative bias on the east/west and only a few pixels with RMSD above 8 mm/8-day.
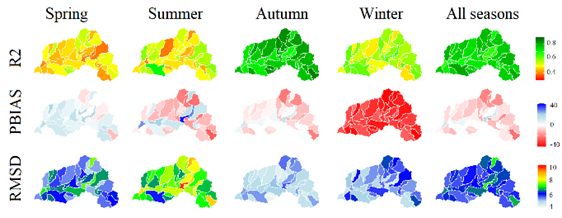
The catchment-scale was analyzed in the Santa Lucia Basin. Figure 3 shows the statistics on the 41 sub-basins of the SWAT model. The highest R2 and the lowest PBIAS and RMSD occur during the autumn. Spring and summer show relatively low PBIAS. Furthermore, ETmodis in the sub-basins near to the main river are slightly above ETswat. R2 values ranging from 0.4 to 0.6 and high RMSD are observed in summer. The winter season shows better R2 than summer. However, it has large negative PBIAS, which produces higher RMSD in the winter than in the autumn. ET estimations through all seasons show R2 above 0.6, slightly negative PBIAS with minor positive zones near the main river, and RMSD around 6 mm/8-day.

Figure 2: R-squared (top panel), percentage bias (mid panel) and root mean squared error (bottom panel) of ET from MODIS16A2 against INIA-GRAS water balance

Figure 3: R-squared (top panel), percentage bias (mid panel) and root mean squared error (bottom panel) of ET from MODIS16A2 against SWAT model

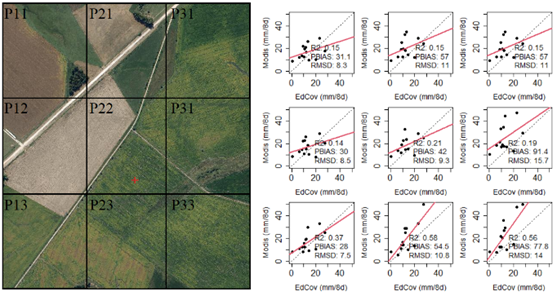
Figure 4: Location of the Eddy Covariance (red cross) with the MODIS16A2 pixels (left panel), and scatter plots of MODIS16A2 against Eddy Covariance (right panel)
Similarities on the farmer scale are shown in Figure 4. The left panel shows an aerial image from IDE14 with the location of Eddy Covariance and the 3×3 neighboring grid of ETmodis. The right panel shows scatter plots of the ETmodis of each pixel vs ETedco. Note that the Eddy Covariance Flux is in pixel P22, and the comparison is done even on the neighboring pixels. The highest similarity is found for P23 and P33 with R2 above 0.5, and the linear regression that passes close to the origin. However, all pixels show large PBIAS above 30%. Both P23 and P33 are the pixels that contain in largest proportion parts of the paddock where the tower was set up, thus greater agreement is expected. P22 also contains a large portion of the paddock, but also comprises other paddocks on the upper left and right parts of the grid cell.
4. Discussion
In this technical paper, the similarities and discrepancies of ETmodis in Uruguay with respect to three reference techniques and scales have been analyzed. The reference techniques give ET estimations on different scales and periods. In all cases, ET was scaled to match with ETmodis. Results show that the similarity of ETmodis with respect to the reference methods changes by season and spatial location.
On the country scale, ETmodis is above ETgras in the eastern part of the country, and below it in the west. This because ETmodis is a dynamic product capable of including variations of Land Cover. Several land uses and land covers are present across Uruguay (crops mainly on the west and native grasslands on the southeast); then the deviation could be explained because ETgras use local information about land use/cover with some assumptions (e.g. grassland, intercepts 100% of radiation, active growth), while ETmodis use a Land Cover Dynamics product with an estimation of vegetation growth, maturity and senescence15. These assumptions could be marking the seasonal deviation between ETgras and ETmodis. Another possible explanation for these discrepancies could be the meteorological input and the soil information used. ETgras uses a very rich network of stations which reduce the uncertainties of the meteorological inputs, while the ETmodis uses meteorological reanalysis data that may be biased from surface data16. On the other hand, soil characteristics control the water balance17, being the effect of soil water availability neglected by the ETmodis algorithm18.
ETswat uses dynamic land-use information, which has been included in the model by management operations and crop rotations. This allows representing the crop development, growth, yield and water uptake of grassland, small grains, and forestry. However, in the winter season ETmodis has large negative PBIAS compared to ETswat. This PBIAS could be caused by two reasons: (1) misrepresentation of the SWAT crop model: parameters like the minimal temperature for the plant growth or the plant uptake compensation factor could be reviewed, (2) meteorological phenomena during the winter that perturb satellite measurements: Some regions of Uruguay are characterized by radiation fog during the winter; furthermore it is know that fog is often a problem in high frequency remote sensing19. Thus, the implications of such phenomena need to be assessed in future works; on the one hand it could affect a part of the satellite spectrum, on the other hand fog could produce a non-negligible amount of water in the form of dew which has not been included in the soil water balance20. Another interesting pattern found in summer was the positive PBIAS observed in the sub-basins near the main river. This could be due to major soil water availability in lowlands or irrigation operations that have not been considered in the current version of the Santa Lucía SWAT model.
The farm-scale highlights the difficulties of estimating ET because of the heterogeneity of small crop fields due to mixed vegetation or land cover within the pixels of ETmodis. The experiment was carried out with limited information of ETedco (only 13 samples of 8-day total ET). Results show similar scatter to that presented in the validation of the MODIS16A2 algorithm, but with slightly more bias21. Note that the validation was done far from Uruguay. Furthermore, the precision of the satellite ET increases with the precision of the ET used by which the satellite product was calibrated22. So, it is to be expected that the uncertainty will be greater for Uruguay.
5. Conclusions
Evapotranspiration derived by MODIS16A2 was compared with three references techniques: the INIA-GRAS water balance, the SWAT model and the Eddy Covariance Flux. Results from this work show that ET estimations depend on seasonality, spatial location and the technique used. Results show the problems that must be solved to quantify the uncertainty of the evapotranspiration estimation in hydrological systems. One of the main difficulties is the lack of direct measurements of ET, specially at the catchment scale. In this scenario: the main challenge is how to merge the different available techniques to deliver an improved estimation of ET.


