1. Introduction
A significant volume of international research has been published related to agriculture impacts on natural resources, particularly water systems and biodiversity, in current circumstances as well as in unfolding climatic changes 1)(2) 3. The research presented multiple policies to meet agreed standards for mitigating environmental impacts of food and fiber production4. Objectively quantifying the environmental impacts of agriculture is hence a fundamental requirement in research and for establishing protocols for the management of commercial production systems2.
Furthermore, at a global scale, Rockström and others5 stated that there are high-risk zones for the Planetary Boundaries -limits within which it is expected that humanity can operate safely- in the biogeochemical cycles of nitrogen (N) and phosphorus (P), because of the growth of fertilizers’ use in modern agriculture, among other sources.
Consequently, agricultural intensification through the subsidy of production systems with external nutrients inputs must be both questioned and properly evaluated. It is thus essential to understand the structural and functional relations between different components of agricultural production systems. It is also recognized that the quantification of environmental impacts at a national geographic level must consider the specific characteristics of agriculture and the whole production context in the country of concern6.
One of the principal agricultural sectors in Uruguay is the dairy industry, which involves 3,300 dairy farmers with an annual production of 2,200 million liters of milk7. The dairy industry is also essential for this country due to the labor involved, and the national and regional/rural income it generates. Thirty per cent of the industrialized milk is for internal consumption and 70% is destined for export, making Uruguay the seventh-largest milk exporter in the world7.
According to Uruguay's Ministry of Environment8, the agricultural sector is the largest contributor to greenhouse gases (GHGs) in the country, being nitrous oxide and methane the gases with the major contribution. In dairy farms, the carbon footprint is dominated by the agricultural production phase, with methane emissions coming mainly from rumen food fermentation, and nitrous oxide emissions from N excretion in urine and the application of N-based fertilizers9.
The evaluation of nutrients export from dairy farms to other ecosystems, such as watercourses, is essential 10)(11) . The environmental impact of dairy farms is a major contributor to the eutrophication of water systems -rivers, lakes and reservoirs-. This is the case, for example, in the Santa Lucía River Basin in Uruguay12. This large basin is the main source of the country’s drinking water, and its contamination is partly associated with the historical presence of agriculture and intensive land uses in its catchment, since it is a dairy production predominant region12.
An agroecosystem sustainability approach is appropriate to address the nutrients’ environmental impact of dairy farms to achieve a robust ecological foundation, using the ecosystem knowledge inherent to agroecology13. Furthermore, this approach considers the production variables and the system components in a holistic way14.
At the farm level, management practices interacting with diverse soil types, topography, climate, and hydrology create substantial spatial and temporal variation in nutrient pollution, requiring national-level evaluation15. At farms, the nitrogen (N) cycle has three main pathways for losses: nitrate (NO₃) leaching, nitrous oxide (N₂O) emissions, and ammonia (NH3) volatilization16. N losses to the atmosphere include N₂O, NH3, nitric oxide (NO), and dinitrogen (N2) 17)(18) , with agricultural practices being a significant source of N₂O emissions, especially from grazing animals18. Biological nitrogen fixation (BNF) by legumes is not a direct N₂O source6, but N₂O emissions can rise due to increased N fertilization and organic N mineralization19. In Uruguay, research shows that efficient fertilizer use in crops does not increase N₂O emissions and minimizing fallow periods can reduce them 19)(20) .
Regarding P, this element is essential for plant growth, but its use in agriculture has increased dependency on finite global rock phosphate reserves, making reliance on inorganic fertilizers inefficient and costly21. P losses occur mainly through runoff and lixiviation, contributing to eutrophication of water bodies 21)(22) . Positive P balances result from surface fertilization and animal feed, leading to soil P stratification and potential runoff losses 23)(24) 25. The legacy of P from historical fertilization practices slows water quality improvement26.
Farm nutrient budgeting is a suitable tool as a first approach to assess those minerals at the farm level. Carbó27 and Gourley and others28 consider that nutrient budget analysis enables to adjust the agriculture management practices for reducing nutrients losses to the environment and improving the monetary margins accruing to farmers. According to Eurostat16, the N and P budgets offer holistic indicators of the environmental pressure of agriculture. The nutrient budget emphasizes understanding the nutrients’ environmental outputs and partitioning the different losses pathways. A recent Uruguayan experience in effluent management evaluation incorporates the nutrient budget approach for five institutional dairy farms, including universities and research institutions 29)(30) .
In addition to supporting farmers’ nutrient management decisions, the budgets can be valuable for informing policymaking and as regulatory tools per se31. Therefore, there is a need for prioritizing and focusing research on measures for mitigating N loss to enhance environmental and agricultural sustainability 32). Similarly, Sharpley and others33 stated that further research is required through modeling the P losses to water systems. For this reason, agroecosystems modeling can be a valuable approach to represent, analyze, and generate scenarios of farm-level components and interactions to consider sustainability34.
According to Railsback and Grimm35, Agent-Based Modeling (ABM) is a very useful instrument for representing complex agroecosystem possibilities and finding solutions related to environmental problematic situations. The system’s approach of ABM is particularly convenient because farm nutrient pollution is a complex problem with many agents involved. Moreover, ABM enables modeling in both geographic space and time simultaneously.
In general terms, at farm level, improving nutrient use efficiency by animals is the most effective form of increasing productivity and decreasing environmental impact36. By restricting the nutrient surplus, the process of environmental losses decreases considerably 14)(37) .
In the above context, the research herein presented focuses on understanding which farming management practices maximize N and P utilization efficiency to reduce losses and negative impacts on the environment using nutrient budgets and modeling assessment. The approach is based on a dairy farm case study within the national productive, socio-ecological, and economic Uruguayan context.
2. Materials and Methods
This section presents the main characteristics of the case study and the two complementary methods applied. The methods analyzed a nutrient assessment focused on nutrient use efficiency for N and P (NUE and PUE, respectively) at the case study farm. The methods are: i) the static annual nutrient budget assessment, with farm scenarios changing main management variables, and ii) the dynamical, daily step Agent-Based Model (ABM) developed for the case study, which aims to evaluate dairy farm management practices that influence N and P dynamics, called Nitrogen Phosphorus Management (NPM).
2.1 Case Study
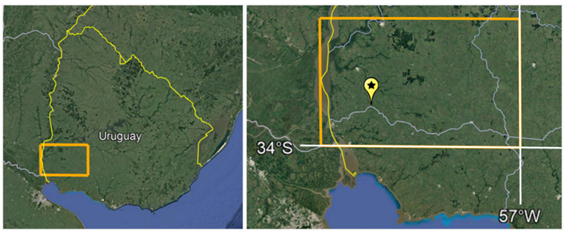
The focus of the case study is a real Uruguayan dairy farm, where the farmer (producer) keeps records of both management and productivity, what enabled to make the N and P budgets and to develop a reliable calibrated ABM for this case. The database analysis was complemented with interviews and farm’s visits to gather further, required information. As is represented in Figure 1, the farm is located at the southern limit of the department of Soriano, Uruguay, in a historic dairy farm region -this means that the focus farm is situated in a Uruguayan representative dairy region38.
This dairy farm has produced artisan cheese since 1973, spanning several generations of the same family. Since its beginning, they have expanded the area, increased the number of cows, and boosted production volume. The family currently consists of five members, all of whom are involved in both farming and cheese production. In addition to the family owners, thirteen workers are employed in the dairy farm and cheese production.
The 2020 case study indicators summary is represented in Table 1, compared with INALE typology to establish a benchmark. It is situated in the Uruguayan typology groups with higher milk productivity, represented as the H1 and H2 groups. The difference between these groups is that H1 farms have a pasture intake minor to 3000 kg DM/ha affected by milking and dry cows, while H2 farms have a pasture intake of more than 3000 kg DM/ha40.
Table 1: Case study summary and comparison with typology
| Case study | H1 | H2 | |
| Milking and dry cows’ number | 343 | 460 | 367 |
| milking cows’ number | 283 | 354 | 296 |
| Milking:dry cow ratio | 0.83 | 0.77 | 0.81 |
| Milking and dry cows’ area | 214 | 491 | 306 |
| Total area (ha) | 261 | 883 | 569 |
| Property (%) | 46 | 37 | 46 |
| Stocking rate (milking + dry cows per ha) | 1.60 | 0.94 | 1.20 |
| Individual yield (l/milking cow/d) | 23.4 | 19.5 | 20.1 |
| Land yield (l/ha/y) | 11,439 | 5,132 | 5,916 |
| Milk yield (l/y) | 2,447,875 | 2,517,695 | 2,168,103 |
| Milk yield (l/d) | 6,707 | 6,898 | 5,940 |
| Pasture intake by ha (kg DM/ha) | 4,452 | 2,026 | 3,954 |
| Silage intake by ha (kg DM/ha) | 1,858 | 2,237 | 1,942 |
| Concentrate intake by ha (kg DM/ha) | 3,279 | 1,868 | 2,118 |
| Pasture intake (kg DM/milking cow/d) | 9.1 | 7.7 | 11.2 |
| Silage intake (kg DM/milking cow/d) | 3.9 | 8.5 | 5.5 |
| Concentrate intake (kg DM/milking cow/d) | 6.7 | 7.1 | 6.0 |
| Total DM intake (kg DM/milking cow/d) | 19.7 | 23.3 | 22.7 |
| Proportion of pasture of milking cow diet (%) | 46% | 33% | 49% |
| Proportion of silage of milking cow diet (%) | 20% | 36% | 24% |
| Proportion of concentrate of milking cow diet (%) | 34% | 30% | 26% |
Source: INALE40
The farm under study can be considered a typical Uruguayan dairy farm because it is characterized by a pastoral-based diet, with grass and legume pastures as the main diet’s components, and it is on a medium scale referring to the farm size in ha3.
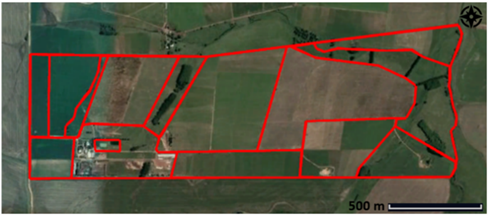
The farm has an extension of 260.5 ha divided into two distinct areas that are in turn subdivided into multiple paddocks. The area used by the dairy cows is named tambo (milking yard) and has 126 ha. The other area of the farm is composed of four sectors used by the rest of the animals and has 134.5 ha (called “support area”). It is worth remembering that parts of the feed reserves (meadow bales) and concentrate (wet corn grain silage) are produced in the support area. Because of this, those feed reserves are considered inputs to the studied and modeled system. The tambo area and its paddocks are represented in Figure 2.
The farm under study is part of a local group of dairy farms called “Los 30,” located in the departments of Colonia, San José, and Soriano in a dairy region of Uruguay41. These dairy farms primarily produce artisan cheese, and the group is coordinated by an agronomist, a veterinarian, and a sociologist. This is an important point to highlight because the research involved communication with the farmers’ group to support peer learning.
2.2 Nutrients Budgets
To begin a nutrient assessment of the farm system, it’s important to note that, unlike greenhouse gas emissions regulated by the IPCC, there is no international legal framework for N and P budgets16. Consequently, there is no standardized international terminology or methodology for developing nutrient budgets, leading to varying terms used by different authors. However, according to Gourley and others31, a nutrient budget is defined as “an accounting approach for nutrient inputs, stores, and outputs.” Similarly, Cherry and others14 describe nutrient budgeting as a valuable and straightforward tool for generating, analyzing, and evaluating farm inputs and outputs. Farm-gate budgets are the most common, as they are easier to calculate using available farmer data and reliable sources14.
In the case of N, it is generally accepted that the main entrance of this nutrient to the agroecosystem is N mineral fertilizer, fixation of atmospheric N by legumes and soil bacteria, deposition from the atmosphere, and livestock feed. There are also minor inputs such as animal bedding and seeds16. N is retained in animal products, milk and meat, crop products, and exported manure16. Furthermore, N outputs are the losses to the environment by volatilization, denitrification, and lixiviation. According to Eurostat16, gaseous losses occur from effluent and manure management systems (EMS) and paddock management.
In reference to P, the inputs are mineral fertilizer and livestock feed. Like N, the P outputs can be divided into animal products, crop products, and environmental losses16. Nutrient losses to the environment can be separated into punctual and diffuse losses. While punctual refers to the loss from the EMS, diffuse refers to the paddock losses26.
Based on the literature reviewed, the main inputs, outputs, and terms used for the nutrient budget developed in the present research are, as P and N input: mineral fertilizer, imported livestock feed, and BNF; and atmospheric deposition for N only. As N and P output we considered milk and meat production. For environmental N losses (at paddocks and EMS) we took into account the N₂O direct losses, volatilization, and leaching. For P environmental losses we considered leaching for EMS, and particulate and soluble runoff at paddocks.
In our work, the nutrients budgets for 2020 were generated using the farm’s records and bibliographic review. When using other research, assumptions were made to estimate the data needed to calculate the budget variables. The data, assumptions, and terminology used in the study are presented in Table 2.
Table 2: Data for nutrient budget, ABM, and scenarios
| Data | Unit | Source | Note |
| Land use | Hectares | (2021 conversation with Case Study Farmer; unreferenced) | Type and area for each crop. Crop and pasture rotation. |
| Mineral fertilization | Kg N/ha/year Kg P/ha/year | (2021 conversation with Case Study Farmer; unreferenced) | Average tambo: 93 kg N/ha/year and 0 kg P/ha/year. |
| Imported livestock feed | Kg/year | (2021 conversation with Case Study Farmer; unreferenced) | For the tambo budget, it is assumed that imported feed is from outside the system, and some proportion is from the rest of the farm area (according to farmer records). Also, it is assumed that bale is completely used in the year. |
| Fixation rate of N | Kg N/ha/year | INIA42 | To calculate BNF. 30 kg N / ton DM of pasture |
| Atmospheric deposition | Kg N/ha/year | Paerl and others43 | - |
| Milk production | Kg milk/year Kg milk/cow/day | (2021 conversation with Case Study Farmer; unreferenced) | - |
| Number of animals | Annual average per category | (2021 conversation with Case Study Farmer; unreferenced) | - |
| Cow DM intake | Kg DM/day | (2021 conversation with Case Study Farmer; unreferenced) | Cow diet per month |
| N and P on livestock feed: pasture, silage, and concentrate | Kg N/kg DM Kg P/kg DM | INIA44 | - |
| N and P on milk | Kg N/kg milk Kg P/kg milk | (2021 conversation with Case Study Farmer; unreferenced) | N on milk = Protein milk/ 6.38 P on milk = 0.1% |
| N and P on meat | Kg N/kg milk Kg P/kg milk | NRC 45) NRC46 | N cow live weight = 2.42% P on meat = 0.72% |
| N on animal excreta | Kg N/cow/day | IPCC17 | Tier 2, equation 10.31. N is available in 25% of manure and 100% of urine |
| P on animal excreta | Kg P/cow/day | P excreta: P diet - P milk | |
| Proportion of time in paddock and in milking parlor | Hours per day | (2021 conversation with Case Study Farmer; unreferenced) | Dairy cows spend 4 hours per day in milking parlor and 20 in paddock. To calculate manure proportion and effluent generation |
| Conversion factor protein to nitrogen | - | INIA42 | - |
| NUE and PUE | % | Aarons and others47 | Animal nutrient use efficiency (%) = Milk nutrient / Nutrient Intake * 100 |
| GIS | - | ArcMap 10.7.148 | Only for ABM. Farmer register implemented on ArcMap |
| Pasture’s growth rate | Kg DM/day | Otero and Castro49 | Only for ABM |
| Absorption of N and P by the plants | Kg N-P/ton DM | IPNI50 | Only for ABM |
| N total, N mobile, and N immobile | Kg N/year | Prado and others51 | Only for ABM. N mobile: 100% urine + – of feces + fertilizer. N immobile: ¼ of feces + BNF |
| N OUTPUTS: Effluent and Manure management | |||
| N₂O Direct | Kg N/year | IPCC17 | Tier 3, equation 10.25 |
| Volatilization | Kg N/year | IPCC17 | Tier 1, equation 10.26 |
| Leaching | Kg N/year | IPCC17 | Tier 1, equation 10.27 |
| N OUTPUTS: Paddock | |||
| N₂O Direct | Kg N/year | Rochette and Janzen6 | Tier 1, equation 11.1 |
| Volatilization | Kg N/year | Rochette and Janzen6 | Tier 1, equation 11.9 |
| Leaching | Kg N/year | Rochette and Janzen6 | Tier 1, equation 11.10 |
| P OUTPUTS: Effluent and Manure management | |||
| Leaching | Kg P/year | Assumption | Assumption: 20% of the P into the effluent management system is leached in the year due to the condition |
| P OUTPUTS: Paddock | |||
| Particulate P | Kg P/ha//year | Perdomo and others25 | Calculated using the P index. Enrichment Index: 1.5; total phosphorus: 450 mg/kg soil; erosion: 4.7 and 6.3 Mg soil/ha/year |
| Soluble P | Kg P/ha//year | Perdomo and others25 | Calculated using the P index. Runoff: 360 (Inumet); CPS: 1.4324 |
| Erosion | Mg soil/ha/year | Erosion 6.052 | Using the program Erosion 6.0 (FAgro, Udelar) for the case study farm situation: Tambo: 4.7 Mg soil/ha/year |
| P Soil analysis | ppm Pbray | (2021 conversation with Case Study Farmer; unreferenced) | Average tambo 41 ppm Pbray |
To evaluate productive alternatives and their impact on nutrient budgets, some management scenarios were discussed and validated with the farmers’ group in two online meetings held in 2021. The research formulated three farm management scenarios to evaluate possible alternatives and solutions to the problem situation with the nutrient budget method. These scenarios intend to answer the questions: which is the impact of the different dairy farm management practices on the nutrient dynamics, and how those practices can reduce nutrient losses to the environment?
The management scenarios evaluated in the research are:
1) BNF-land use: BNF drops 20% compared with current situation; 17 ha of Leguminosae crop area is replaced by Festuca fertilized with the same farmers criteria.
2) Dairy cows’ feed: Pasture 56%, Silage 20%, Concentrate 24% , 10% increment on pasture intake. Same silage intake. 10% decrease in concentrate intake.
3) Stocking rate: Number of dairy cows drops 20%. Assumption: Reduction to 80% milk production and total dairy cows feed compared to the current situation.
It is important to note that the annual nutrient budget for current situation and scenarios are a static approach. Therefore, ABM provides a complementary method to recreate dynamically both the spatial and temporal distribution of N and P on the farm, linked with farmers grazing and feeding management practices.
2.3 NPM Agent-based Model
The ABM simulation was developed on the NetLogo platform version 6.2.53, a multi-agent programmable modeling environment suitable for modeling complex systems.
The development of the model in the case study was also based on the register’s records provided by the dairy farmer and from literature review. It was adjusted using the nutrient budget previously described (see Section 2.2). The objective of building the ABM is to dynamically recreate as well as to explicitly represent the spatial distribution of N and P across farm paddocks, as well as the EMS. This model helps to visualize annual dynamics that cannot be captured by the nutrient budget methodology previously described.
The farmer’s registers and monitoring corresponded to year 2020, which included (on a monthly scale) the number of animals, milk composition and production, diet profile (proportion of pastures, reserves, and concentrates), and land use (paddock land use records). Only the pasture area of the case study was modeled (see 2.1 section). The central dynamics of feeding, grass management, and milking in the ABM carried out a daily step (see Table 2).
The allotment of animals to paddocks was discussed and validated with the farmer as the main grazing decision rule. The ABM was implemented assigning the animals to the pasture paddock (set of patches at the ABM) with the highest average biomass, keeping the cows in that paddock up to a remnant of 1500 kg DM/ha. The animals consume the DM of each diet component according to the monthly diet profile records provided by the farmer. N and P excretes at each step were proportionally assigned to time spent at pasture paddocks and milking parlor (20 h/24 h, and 4 h/24 h, respectively). The ABM model calculates daily the N and P budget for each patch. Also, the different pastures have an individual daily growth rate, and have a protein (N) and P content. The farmer provided the soil P content by soil analysis information that was used at initialization, as described below.
The ABM is presented in the next paragraphs, as suggested by Grimm and others54, using a summarized version of ODD (Overview, Design concept, and Details) protocol:
Purpose - The overall purpose of the NPM model is to evaluate dynamically dairy farm management practices that influence N and P budget and its spatial distribution. Specifically, the model addresses the following questions:
• According to farming practices in the case study, which is the spatial and temporal pattern of nutrients at the modeled system?
• Which is the contribution of each nutrient budget component (excreta, paddock environmental losses, effluent environmental losses, and biological N fixation) to whole system results?
Entities and states variables - The model includes the following entities: Patch, Cow, EMS. The Entities and States Variables of NPM are described in Table 2. The spatial and temporal resolution and extent: a time step in the model represents one day, and the simulation can be for the year of evaluation, emulating the 2020-year farm performance. NPM model is spatially explicit and represents the area of the dairy farm case study. Simulations are based on 13 paddocks with different extents each, representing a total area of 126 hectares. The landscape or “world” is a grid of 50×20 patches with 2600 m2 each, but only 846 patches represent the tambo area, to fit to GIS information provided by the farmer.
Process overview and scheduling - The core process of the NPM model is the nutrient budget in each patch. This process is repeated every time step and is based on these other processes: pastures growth according to sown species, nutrients dynamics and presence, and permanence of cow in the patch. It is important to highlight that the NPM model represents the scale of colors according to the variable value of each patch, which helps state visualization. Also, the interface represents the patches average variable value of the same paddock, as presented in the Results section.
Scheduling is very significant in the NPM model because it represents the farmer management. The scheduling refers to number of dairy cows, milk production and composition, dairy cows’ diet, fertilizer application, and pasture growth rate, according to farmer registry information.
Design concepts - The most important design concepts of the model are:
• Objective: The design model objective is to represent the farm case study, using GIS and land use information.
• Observation: The number of cows, the animal diets levels, the cow’s production, and the total amount of biomass in each paddock are recorded daily.
• Communication: The main communication variables are represented in the model interface. Its interface includes the use of “on/off switch” from each nutrient budget component, the N and P use efficiency (NUE and PUE, respectively) graphs, and the dynamics of the N and P separately in paddock and EMS. The interface represents in a color scale the values of the main variables of N and P dynamics. These specific design aspects are to facilitate collective learning and communication between farmers, researchers, and other actors.
• Interaction: There exist two kinds of interactions: cow-patch and cow-EMS.
• Stochasticity: By default, there is no stochasticity. When initializing, there are variables generated with random values like initial DM availability of paddocks.
• Adaptation: Cows react to decreasing pasture biomass levels in paddocks by being less attracted to them, and after a limit level, they move to another paddock with more biomass.
Initialization - The NPM model is initialized with the information provided by the farm, like the land use and the number of dairy cows (see Table 2). Also, it is essential to highlight that the GIS is included in the initialization. Furthermore, the simulations were set to start on 1st March.
Input data - Model dynamics are driven by input data representing data from different sources, including extensive literature review and data from the farm case study. The data from the model development is described in Table 2.
3. Results
This section presents results of i) the annual nutrient budget of the tambo area under current management compared with the three scenarios previously defined, and ii) the dynamical space-time explicit simulations of nutrient stocks and flows generated by the NPM tool.
3.1 Nutrient Budgets
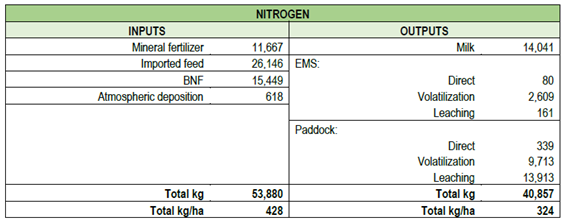
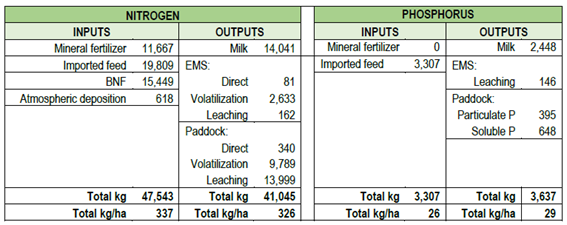
Starting with N annual budget, Table 3 summarizes the N annual budget for tambo paddocks considering the year 2020 information.
As shown in Table 3, the N inputs are divided into mineral fertilizer, imported livestock feed, BNF, and atmospheric deposition. Considering the proportion of these N inputs, where the main N inputs are the imported livestock feed (48%), the second most important is the BNF (29%), thirdly the mineral fertilizer (22%), and the contribution of atmospheric deposition is minor (1%).
The analysis of N outputs in the dairy farm nutrient budget indicates that 66% of the N leaving the system is retained in milk, while the remaining 34% corresponds to environmental losses. Furthermore, the tambo paddocks' environmental N outputs can be considered losses divided into paddock and EMS losses.
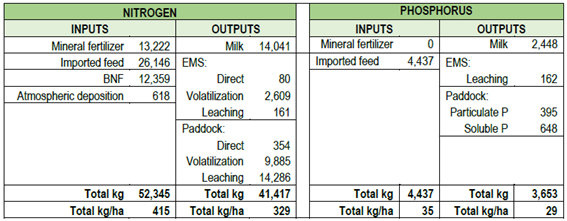
Regarding the P budget from the tambo paddocks, Table 4 summarizes the annual results.
Since the farmer did not apply P fertilizers to the paddocks in 2020, the only P inputs corresponded to imported livestock feed; unlike N, no other forms of inputs were identified. This critical point is explained in the Discussion section. Approximately two-thirds of P outputs are in milk, and the balance one-third consists of environmental outputs.
Considering the system N outputs proportion, classified as volatilization, lixiviation, and direct N₂O nutrient losses, it represents 81.9%, 5.3%, and 2.7%, respectively, for Paddocks (being 89% of total N system outputs); and 4.5%, 6.4%, and 0.1% for EMS, respectively, (being 11% of total N outputs). For P environmental losses, paddocks have 53.9% of soluble and 33.1% of particulate P runoff, totalizing 87% of environmental losses. The remaining 13% corresponds to EMS direct losses to the environment.
The next section shows the result of the management scenarios in the nutrient budget methods. As was explained before, the management alternatives were discussed and validated with the farmers’ group.
3.2 Nutrient Budgets with Different Management Scenarios
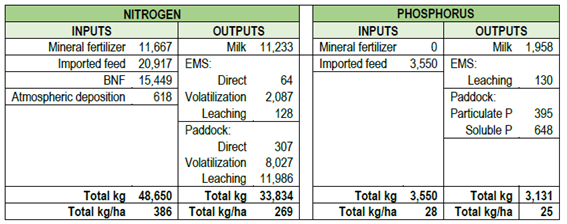
Table 5 summarizes how the farm management scenarios assessed impact nutrient inputs, outputs, and cow’s nutrient efficiency.
Scenario 1 - Land use: Represents the change in land use (see Table 6). This modification of land use does not change the NUE but changes the dairy system's N inputs and outputs. The proportion of N inputs varied compared with current situation, being 50% for imported livestock feed, 25% for mineral fertilizers, 24% for BNF, and 1% for atmospheric depositions. The proportion of mineral fertilizer increased and the N fixed by the Leguminosae decreased. In addition, the environmental N outputs increment 560 kg N/year (see Table 6).
Scenario 2 - Type of diet: Refers to the cow's diet proportion of pasture, supplement, and concentrate. As shown in Table 7, while the NUE maintains the current situation value, the PUE increases 3% compared to the current PUE. Furthermore, in this management scenario, the N input drops by 50 kg N/ha and the N output increases by 2 kg N/ha. Also, the proportion of N inputs changes because the imported livestock feed decreases compared with the current farm situation. At this scenario, N inputs proportion is 42% for imported livestock feed, 32% for mineral fertilizer, 25% for BNF, and 1% for atmospheric depositions.
The P input drops by 9 kg P/ha, and the P outputs maintain the same value per hectare. However, the farm P environmental outputs (kg/year) change in the value of the punctual losses of the EMS (see Table 7).
Scenario 3 - Stocking rate: Refers to a decrease of stocking rate, showing that the total N output is lower because not only the N on milk decreased, but also the environmental N losses did (see Table 8). Still, the P outputs decreased due to the lower milk production. Moreover, this scenario covers a lower effluent generation due to the stocking rate reduction (see Table 8).
Since the nutrient budget method has an annual time scale and does not represent dynamical interactions between system components, the following section analyzes the nutrient flows in a dynamic way only for the current farm situation by agent-based approach.
3.3 Agent-Based Model NPM
Before examining the different model nutrient dynamic results, it is fundamental to understand how the NPM model represents the dairy farm case study. Figure 3 (screen capture at model initialization stage) shows that the NetLogo interface displays the dairy farm paddocks with their name using the GIS information provided by 2021 conversation with Case Study Farmer. The milking parlor (red house) is situated in its actual place and the cows are in the paddock at initialization. In addition, Figure 3 includes the interface generated graphs for monthly cow number, milk production and protein, and cow intake across the year simulated.
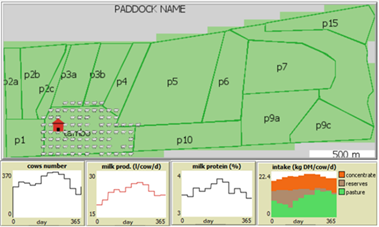
Figure 3: NPM model at initialization stage. At worlds view the paddock identification is labeled at the centroid of each one53
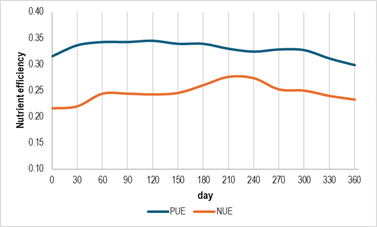
Considering the cows’ nutrient use efficiency calculated by the model simulation, Figure 4 shows that there has been an intra-annual variation in the NUE and PUE across the year 2020 simulation. Both curves had a gradual increment in the first trimester and then a diminution of the efficiency in the last months of the simulated year. The month variation is associated with the different monthly diets and the milk production in volume and in protein concentration (see graphs at Figure 3; milk protein and intake).
The cows’ nutrient use efficiency (Figure 4) presents monthly variations along the year, according to the animals’ diet profile and milk production and composition. The annual average and standard deviation were 24.6% ± 1.7% and 32.9% ± 1.7% for N and P, respectively, reaching a maximal value of 27.6% for NUE in October and 34.5% for PUE in June.
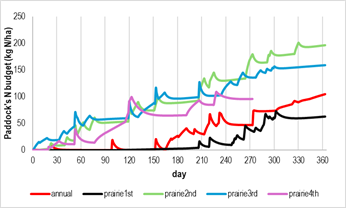
Figure 5 shows N budget evolution at the paddocks at different land uses across the year simulation.
As shown in Figure 5, N accumulates in paddocks throughout the year, particularly in prairies older than one year, which were grazed more frequently than annual forage crops and prairies established in 2020. The average paddock accumulated 98.7 kg N/ha, predominantly attributed to the immobile fraction. Extreme values ranged from a minimum accumulation of 33.7 kg N/ha in annual forage crops to a maximum of 100.9 kg N/ha in second-year prairies.
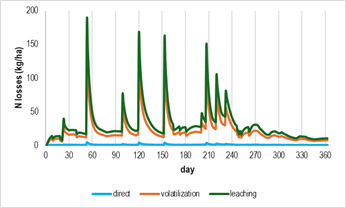
The environmental losses fractions are presented in Figure 6.
As shown in Figure 6 , volatilization and leaching are the main environmental outputs. Annual dynamics of environmental losses represent mainly fertilization events according to farmer’s scheduling linked to land use and animals’ diet profile. For example, in June, the highest pick of volatilization and leaching occurs when farmers fertilize 56% of the area (on annual grass crops and 2-, 3-, and 4-year old prairie paddocks) with an average of 41.2 kg N/ha.
On the other hand, the accumulation of N at the EMS presented a barely linear increment over the 2020-year simulation (EMS N kg = 20.499 * day -214.83; R² = 0.9966), reaching 6975 kg N/year with a proportion of 70-30% for mobile and immobile fractions, respectively.
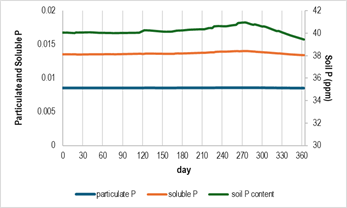
Related to P dynamics at paddocks, Figure 7 shows soil P content and particulate and soluble environmental losses evolution across the yearly simulation.
Figure 7 shows a relative constant quantity of that nutrient across the 2020-year simulation, averaging 40.3 ppm in soil. Even if the farmer decides not to fertilize with P, cows’ deposition compensates pasture extraction for growing. The 60-day simulation presents a fall in P soil content, reaching 39.4 ppm, but it represents less than 1.5% of difference with initial soil P concentration.
Regarding P accumulation at the EMS, it presented a linear increment (EMS P kg = 1.968 * day - 35.18; R² = 0.9925), reaching 664.4 kg P/year, and its loss to the environment by leaching totalized 166.1 kg P/year.
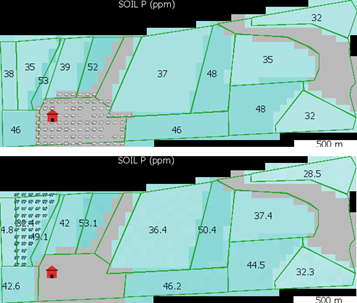
As was pointed out, ABM allows the spatialization of complex system dynamics. Figure 8 illustrates the soil P dynamic, including the initial (upper) and final (lower) soil P situation after one year of simulation. The model interface represents the P soil change by color, and the graphs allow the understanding of the spatial distribution in the ground.
As shown in Figure 8, spatial distribution of P is influenced by paddocks’ soil use and grazing strategy. Since farmer did not apply P fertilizer in 2020, and there is no biological fixation for P either, only forage P absorption and environmental losses by lixiviation are considered as outputs at patch budget assessment. The initial average P soil analysis of 41 ppm with spatial heterogeneity was recorded by farm soil analysis and the variation across the simulated year. While only considering cows’ excretion, the soil P average value increases across the year adding 7 ppm to initial soil content. Nevertheless, at the full paddock budget, the P soil concentration is relatively stable across the year simulation (see Figure 7).
Spatial heterogeneity of P soil in the system is explained by cows grazing sequence, leaded by the entering-leaving paddock criteria defined at 2.3 section. Prairies of 2- and 3-year sown were more frequently grazed due to its DM availability. The soil P in paddock with those frequently used land use reached 58 ppm at simulation considering only cows’ excretion.
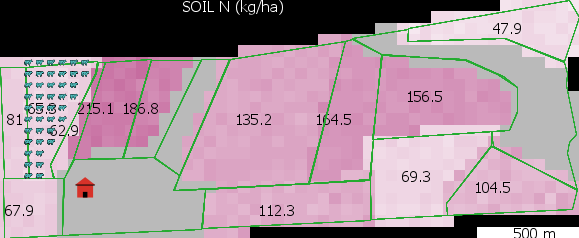
Regarding N simulated dynamics, Figure 9 illustrates paddock N budget.
The paddock colors (Figure 9) show the value of N on soil -the darker magenta, the higher level of N-. As for P nutrient, the spatial heterogeneity of N in the system is explained by grazing circuit in both partial and complete budgets. The more frequently grazed paddocks (2 and 3-years old prairies, see Figure 5) presented the highest values of N budgets. For those more frequently grazed paddocks, the accumulation was 245 kg N/ha only by cows’ depositions, and 98 kg N/ha in the complete budget simulation. In average terms, considering only cows’ excretion at paddock budget, the N content reached 152.2 kg N/ha, whereas in the complete budget it reached 60.7 kg N/ha. It is worth mentioning that, different from the P analysis, the initial N on soil assumed in this simulation is 0. This means that values at Figure 9 represent cumulated N at paddocks, since all of them finalize simulations with large and positive values.
4. Discussion
The results of the analyses of the typical Uruguayan dairy farm in the nutrient budgets produced values similar to regional and European research. Carbó27 showed nutrient budget values related to N and P per hectare (value = inputs - outputs) of 121.5 kg N/ha/year and 18.3 kg P/ha/year -results very similar to those presented in this work-. Similarly, other research by van Leeuwen and others55 reported five pasture-based dairy farms with inputs and outputs values similar to those obtained in the Uruguayan dairy farm case study. This suggests that the methodology used in our work produces common dairy farm values. However, it is essential, when comparing results with similar research, to consider the farm's productive reality and the local production conditions. In this context, Stirling and others56 showed that the Uruguayan dairy systems evaluated maintained an N surplus of 71 kg N ha-1 between 2014 and 2019. Furthermore, Lizarralde’s9 research in Uruguay produced similar values for nitrous oxide emissions from the effluent management system and N excreted per cow per year. According to a summary of studies from New Zealand, France, the United Kingdom, and Denmark57, the leaching found in that summary is similar to the value for the N input level of the case study farm.
Considering the P dynamics, in this work the soluble fraction losses from the paddock were more significant than the particulate losses. Similarly, De Lucca24 demonstrated that the most considerable P losses proportion was in the soluble fraction in all the treatments evaluated. In both the present research and De Lucca's24, the USA soluble limit was exceeded in all treatments, including the non-application (1 kg soluble P ha-1 year-1).
The P index (the sum of soluble and particulate P) helps to evaluate the management area level and identify the area with the highest contribution of P25. While the P index can be conceived as a static value for the current situation, the P budget can be analyzed as a measure of direction, because it involves more variables.
Regarding NPM model, according to Wedderburn and others58, the ABM allows the exploration of farm systems’ behavior. The NPM model developed and applied in our research allowed visualizing the farm heterogeneity between the different paddocks. It was also possible to evaluate the nutrient dynamics depending on land use and time of cow grazing. The spatialization of the NPM model is beneficial to analyze the different management decisions. Similarly, Veltman and others59, using a process-based model for a dairy farm, proved that reducing the N and P environmental losses across beneficial management practices is possible.
According to the NPM model, in the case study farm, soil P levels could be maintained even without fertilizer application, due to the contribution from cow excreta, as demonstrated in the “cow excreta only” simulation. In the same way, De Lucca24 demonstrated that P soluble losses exceed desirable limits in the non-application treatment. The high P exportation suggests that it is necessary to introduce other management alternatives apart from not fertilizing. Because of that, to reduce the level of P on soil in the medium term, it is required to apply different management practices depending on the specific soil P level and the soil stratification. For example, it is possible to incorporate extractive plant species in terms of nutrients and export them in forage or grain. Moreover, if the stratification level is high, periodic soil inversion is recommended to break P 26)(60) .
Animal nutrient use efficiencies based on dietary nutrients and nutrients in milk are beneficial to compare the potential for environmental impact. According to literature 14)(15)37)(56) 61, improving cows’ NUE and PUE is the most effective form of increasing productivity and decreasing environmental impact. According to a study by Aarons and others47, a case study farm with a NUE of 24% is in the range of commercial dairy farms. Furthermore, Powell and others 62) found a NUE of 24% for a similar stocking rate, whilst Aarons and others47 reported an average of 21% NUE. Furthermore, the present work found a PUE of 33% for the current farm situation, which according to Aarons and others47 is in the expected range. Related to the NUE, it is necessary to adjust the cow's diet to the protein required. This means changing the N intake in the diet because the higher the N content, the higher the N losses to the environment.
Regarding the farm management scenarios, according to Darré and others3, factors related to grazing system, land use, type of diet, and number of inputs can be more relevant in determining the environmental impacts of dairy systems than productivity per se. These management factors are referred to the scenarios evaluated in this work.
Lemaire and others63 analyzed management situations to minimize trade-offs between farm production and the environment, stating that an overly uniform land-use system and the excessive N-P loads in intensive animal areas lead to unacceptable environmental impacts. The present work's results similarly showed that the current situation of the dairy farm’s high stocking rate can be partly responsible for high N and P losses to the environment.
Regarding the nutrient budgets with different management scenarios, the Scenario 3 tried to understand how a lower stocking rate impacts the results -it showed lower environmental outputs-. Predominantly, they are expressed in paddock and effluent N losses. In the case of P, the reduction is only in the effluent losses, probably because it is not possible to see an influence on paddock losses due to the limitations of the nutrient budget approach. The reduction in environmental losses is mainly due to the lower generation of excreta due to fewer cows, as was stated in the bibliography 22)(61) . Additionally, the NPM model is beneficial for evaluating and understanding the excreta impact on the paddock, spatially explicit.
In Scenario 1 of land use, because of the reduction of Leguminosae, the proportion of the inputs changed, reducing the BNF and increasing the inputs that affect the environment and cost money to purchase, like mineral fertilizer. In a similar study, Garcia and others64 concluded that Leguminosae in the pastures can significantly reduce the farm N inputs, and increment the N availability for the grass, nutrient cycling, and ecosystem services. Rochette and Janzen6 also claimed that BNF is not considered a direct source of N₂O emissions. Furthermore, this scenario showed that the BNF does not generate environmental losses and reduces mineral fertilizer use. Although the total input of N into the system decreases 1535 kg N, this input reduction is in BNF, and the farm loses autonomy to external nutrient inputs65.
Turning to the cow’s diet, some research suggests the diet strongly influences environmental losses 3)(10) 15. What is more, Aarons and others47 stated that imported animal feed is a more significant source of nutrients than fertilizer inputs. This means that the proportion of pasture versus concentrated feeding in the cow’s diet defines the possible farm nutrient losses 3). Furthermore, according to Ryan and others15, the more kilograms of concentrates in the diet, the higher N is available for leaching. In Scenario 2 in the present research, the reduction of concentrates on the cow’s diet reduces the P outputs in the punctual losses of the effluent management. This reduction is because the animal produces a lower P on excreta with the new diet. Furthermore, it is not possible to evaluate the change of P diffuse losses of the paddock because the nutrient budget approach is not sensitive to that change.
The scenarios evaluated in this work show the same NUE value previously described, except for Scenario 3, which reduces 3% because of a probable limitation in the calculation methodology. In the case of PUE, when the cow’s diet was less concentrated (Scenario 2), it was transformed to 36%, being the dairy cows more efficient in converting the P feed into milk. Besides, in the fewer stocking rate of Scenario 3, the PUE was 30%. It is essential to highlight that the scenarios’ applicability to the NUE and PUE analysis is limited because of the scenario’s methodology used and their impact on the nutrient budget.
5. Conclusions
This study offers new insights for enhancing the sustainability of dairy farming in Uruguay through improved nutrient management. By analyzing a typical Uruguayan dairy farm, the research highlights key strategies for maximizing nutrient efficiency and minimizing environmental impact. The key findings of this work are presented below.
-Reducing reliance on external livestock feed, such as grain or silage, and increasing the proportion of grazing in cows’ diets can significantly lower environmental impacts. However, it is crucial to optimize the cows’ diet, particularly in terms of protein levels. As discussed with farmers, some analyses like milk urea nitrogen status and diet adjustment to avoid protein overfeed by periodic feed sampling and analyses can be quotidian and effective tools to adjust nutrient demand.
-Excessive phosphorus (P) accumulation in soils presents a persistent challenge. This study indicates that ceasing P fertilization alone is insufficient to reduce soil P levels, given the contributions of dietary phosphorus and stocking rates.
-Increasing the time animals spend in pastures and reducing the time in milking parlors and on roads can enhance the role of cow excreta as a natural fertilizer, reducing the need for external nutrient inputs and minimizing effluent losses.
For future research, expanding the application of the NPM model to the entire farm area could provide a more comprehensive understanding of nutrient flows and management strategies across diverse pasture conditions and animal densities.
Testing the management scenarios evaluated in the NPM model in real-world settings would further validate the model’s effectiveness.
Long-term simulations, as suggested by the case study farmer, could offer deeper insights into the sustainability of various management practices and improve decision-making for dairy farmers.
In a broader implication, this research underscores the importance of farmer-researcher collaboration, which enhances both the practical relevance of scientific findings and the farmers’ understanding of environmental issues. The NPM model has proven to be an effective tool for facilitating this collaboration and supporting sustainable management decisions.
Although focused on a Uruguayan case study, the methodologies and findings presented herein are broadly applicable to other regions, providing a valuable framework to make progress in sustainable agricultural practices globally.


